GBP/USD recorded strong losses last week, dropping 150 points. The pair closed at 1.2264. This week’s key event is Manufacturing Production. Here is an outlook for the highlights of this week and an updated technical analysis for GBP/USD.
It’s been a busy start to the New Year. The ISM Manufacturing PMI improved and beat expectations. Employment numbers were a mix, as wages edged higher but NFP payrolls fell considerably. The Fed meeting minutes were cautious, as policymakers wait to see how the economy will respond to Donald Trump’s economic policies. In the UK, all three PMIs pointed to expansion and beat their estimates, but the pound was unable to capitalize on these strong releases.
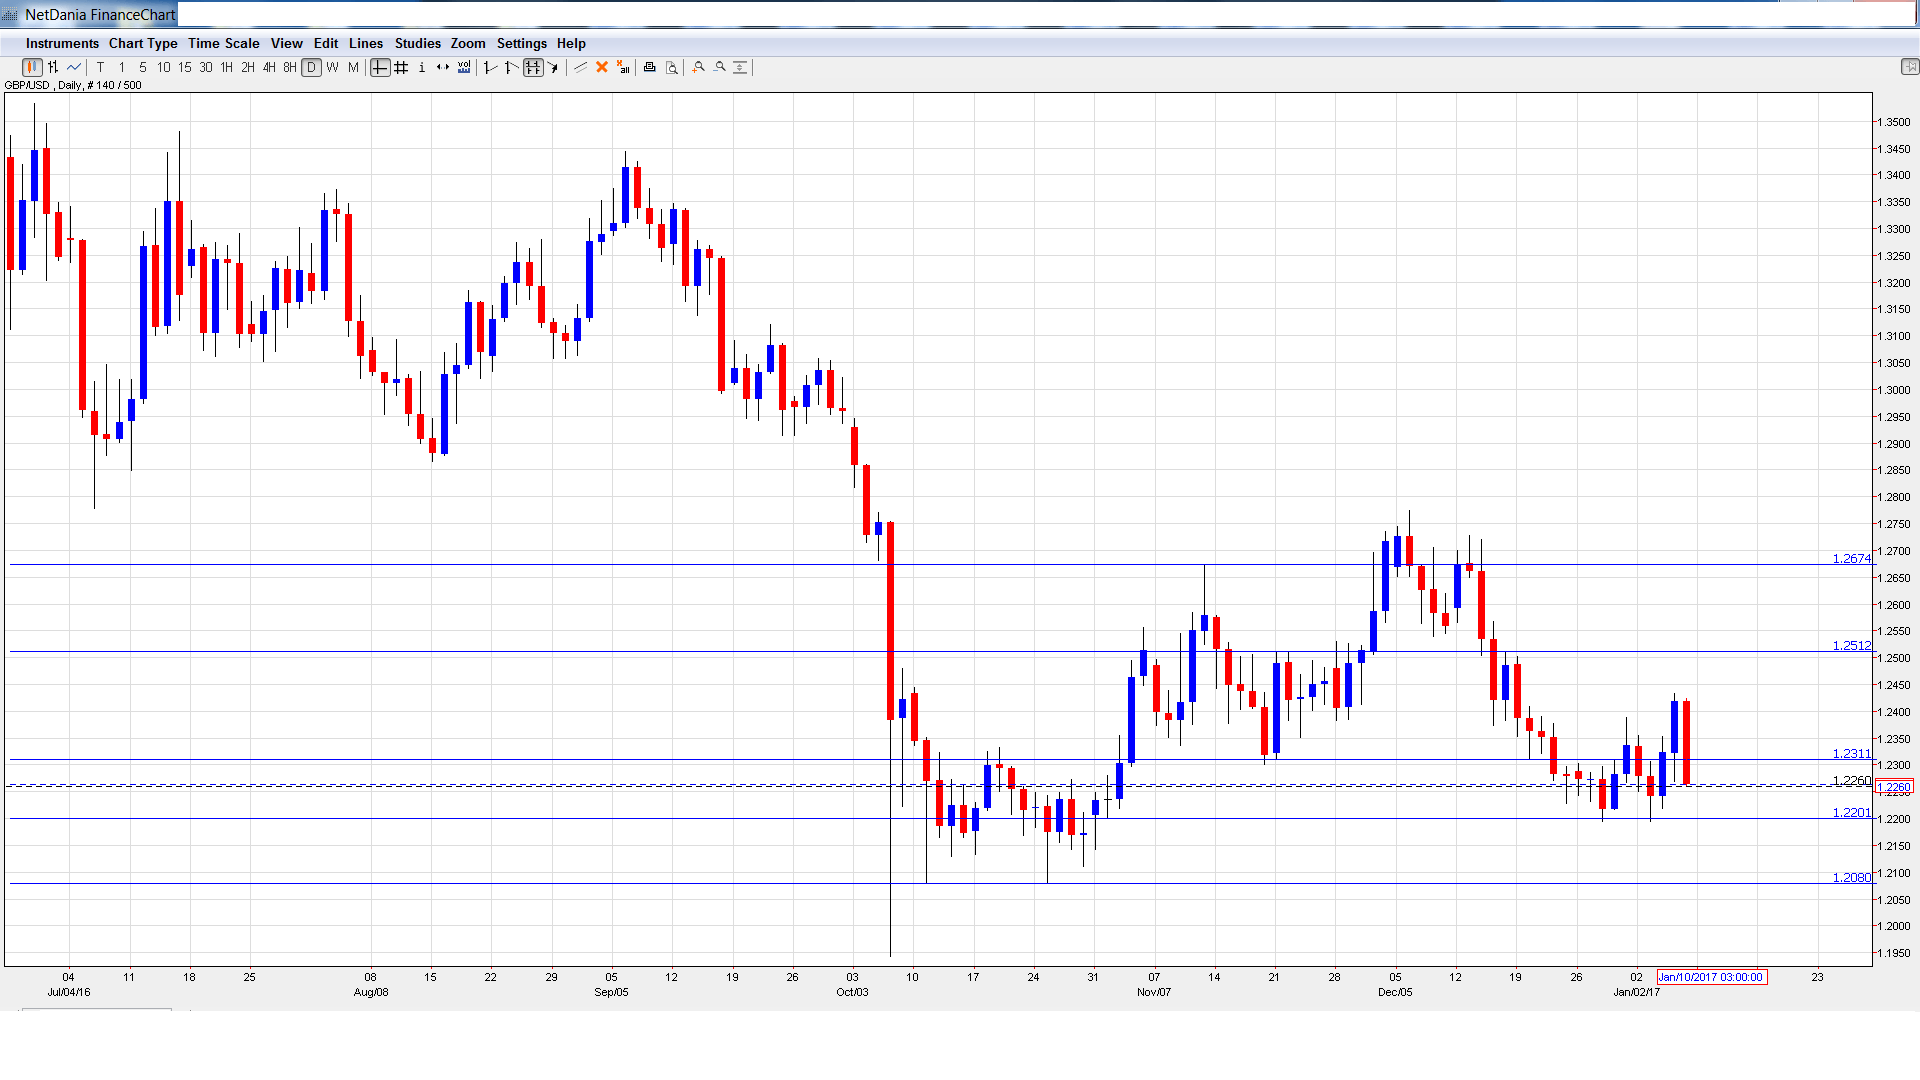
[do action=”autoupdate” tag=”GBPUSDUpdate”/]GBP/USD graph with support and resistance lines on it. Click to enlarge:
- Halifax HPI: Monday, 8:30. The housing inflation index provides a snapshot of the level of activity in the housing sector. The index posted a weak gain of 0.2% in November, matching the forecast.
- BRC Retail Sales Monitor: Tuesday, 00:01. This indicator measures retail sales volumes in BRC shops and precedes the official Retail Sales release. The indicator slipped to 0.6% in November.
- Manufacturing Production: Wednesday, 9:30. This is the key event of the week, The indicator declined 0.9% in October, well short of the forecast of +0.2%. The markets are expecting a strong turnaround in the November release, with an estimate of 0.6%.
- Goods Trade Balance: Wednesday, 9:30. The UK trade deficit narrowed to GBP 9.7 billion in October, better than the forecast of GBP 11.9 billion. The deficit is expected to widen to GBP 11.2 billion in November.
- NIESR GDP Estimate: Wednesday, 15:00. This indicator provides a monthly estimate of GDP, which is only released on a quarterly basis. The indicator has been steady, with three straight readings of 0.4%.
- 10-year Bond Auction: Thursday, Tentative. The December auction showed little change, with a yield of 1.39%.
- BOE Credit Conditions Survey: Friday, 9:30. The BoE releases this report each quarter. The report includes data on lending to consumers and businesses. It is closely monitored, as borrowing and spending levels are closely connected.
* All times are GMT
GBP/USD Technical Analysis
GBP/USD opened the week at 1.2334 and quickly dropped to a low of 1.2194, testing resistance at 1.2201 (discussed last week). The pair then reversed directions and climbed to a high of 1.2433. GBP/USD posted sharp losses late in the week, closing at 1.2264.
Live chart of GBP/USD:
Technical lines from top to bottom
1.2674 was a cap in November.
1.2512 is next.
1.2311 has switched to a resistance role following sharp losses by GBP/USD last week.
1.2201 is an immediate support line.
1.2080 is protecting the symbolic 1.20 level.
1.1943 is the final support line for now.
I am bearish on GBP/USD.
The US economy enters 2017 in fine shape, and president-elect Trump has promised increased fiscal spending and tax cuts, which could increase inflation. If this scenario materializes, the Fed may have to step in with a rate hike in early 2017, which could send the US dollar even higher.
Our latest podcast is titled Is the FED Data or Donald Dependent?
Follow us on Sticher or iTunes
Further reading:
- For a broad view of all the week’s major events worldwide, read the USD outlook.
- For EUR/USD, check out the Euro to Dollar forecast.
- For the Japanese yen, read the USD/JPY forecast.
- For the kiwi, see the NZD/USD forecast.
- For the Australian dollar (Aussie), check out the AUD to USD forecast.
- For the Canadian dollar (loonie), check out the USD to CAD forecast.
