It was another awful week for GBP/USD, which plummeted almost 250 points. The pair closed the week at 1.5164, its lowest weekly close since May. This week’s highlight is Manufacturing Production. Here is an outlook on the major events moving the pound and an updated technical analysis for GBP/USD.
The British pound continued its slump, falling day after. Some of the drive lower came from weak data in the UK, but sterling suffers more from the “risk off” flows, that favor the dollar, yen and euro before the pound. In the US, employment numbers were mixed, which only complicates things for the Fed, as it mulls over a rate hike. Much of the pound’s slide last week can be blamed on the PMI reports, as all three PMIs were short of the forecast and Services PMI was well below expectations.
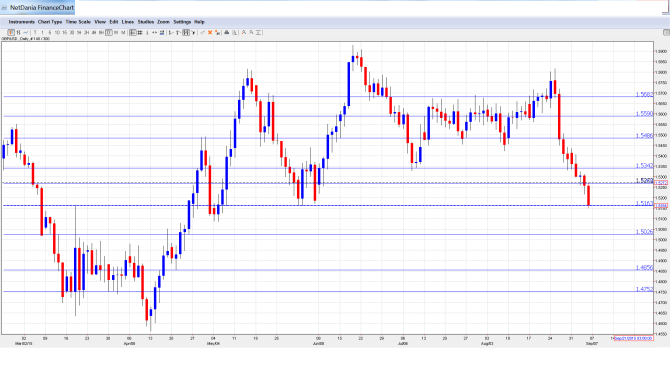
[do action=”autoupdate” tag=”GBPUSDUpdate”/]GBP/USD graph with support and resistance lines on it. Click to enlarge:
- BRC Retail Sales Monitor: Monday, 23:01. This indicator measures the change in retail sales in BRC stores, and is a useful gauge of the strength of consumer spending in the UK. The indicator posted a gain of 1.2% in July, weaker than the 1.8% gain we saw a month earlier.
- Halifax HPI: Tuesday, 8th-10th. This index provides a snapshot of the level of activity in the UK housing sector. The indicator disappointed in July, posting a decline of 0.6%, well short of the forecast of 0.5%. The markets are expecting a strong turnaround in the August report, with an estimate of a 0.5% gain.
- 30-year Bond Auction: Tuesday, Tentative. The average yield on 30-year bonds came in at 2.73% in the July auction, slightly below the yield of 2.86% in the June auction. Still, this is a higher yield than we saw earlier in 2015.
- BRC Shop Price Index: Tuesday, 23:01. This index looks at consumer inflation reported from BRC shops. The index continues to post declines, and showed little change in the July report, with an estimate of -1.4%.
- Manufacturing Production: Wednesday, 8:30. This is a key indicator which should be treated as a market-moving event. The indicator improved in June, posting a modest gain of 0.2%, which matched the forecast. The markets are expecting another gain of 0.2% in the July report.
- Trade Balance: Wednesday, 8:30. The trade deficit widened in June, coming in at -9.2 billion pounds, very close to the forecast. The markets are expecting a larger deficit in July, with an estimate of -9.5 billion pounds.
- NIESR GDP Estimate: Wednesday, 14:00. This monthly indicator helps analysts track GDP, which is only released on a quarterly basis. The indicator has been quite steady, posting two straight gains of 0.7%.
- RICS House Price Balance: Wednesday, 23:01. The indicator showed some slight improvement in the July reading, coming in at 44%, which was within expectations. Little change is expected in the August report, with a forecast of 46%.
- MPC Official Bank Rate Votes: Thursday, 11:00. The MPC surprised the markets in the August vote, with only 1 of the 9 members voting in favor of a rate hike. The markets had expected 2 members to vote in favor of a rate increase. The forecast for the September vote stands at 8-1 in favor or holding rates at the present level of 0.5%.
- Official Bank Rate: Thursday, 11:00. The BOE has held the benchmark rate at 0.50% since February 2009. The BOE is expected to maintain this level in its September rate announcement.
- Asset Purchase Facility: Thursday, 11:00. No change is expected in QE, which currently stands at 375 billion pounds, and has been pegged at this level since July 2012.
- MPC Asset Purchase Facility Votes: Thursday, 11:00. The markets are expecting all 9 members of the MPC to vote to maintain the current QE level of 375 billion pounds. MPC votes to maintain QE at this level have been unanimous since July 2013.
- Construction Output: Friday, 8:30. This minor indicator improved in June, with a respectable gain of 0.9%. However, this was well below the estimate of 2.4%. A softer gain is expected in the July report, with a forecast of 0.5%.
* All times are GMT
GBP/USD Technical Analysis
GBP/USD opened the week at 1.5414 and quickly touched a high of 1.5436. It was all downhill from there, as the pair dropped all the way to 1.5151, testing resistance at 1.5341. The pair closed the week at 1.5164, just above support at 1.5163 (discussed last week).
Live chart of GBP/USD: [do action=”tradingviews” pair=”GBPUSD” interval=”60″/]
Technical lines from top to bottom
With GBP/USD posting sharp losses for a second straight week, we begin at lower levels:
1.5682 was an important cap in December 2014 and January 2015.
1.5590 is the next line of resistance.
1.5485 held firm last week and has strengthened in resistance.
1.5341 has switched to a resistance role following the pound’s sharp losses last week.
1.5269 is next. It was an important support level in March.
1.5163 was tested and could see action early in the week.
1.5026 has provided support since April.
1.4856 is a strong support level.
1.4752 is the final support line for now.
I am bearish on GBP/USD.
The pound is getting steamrolled by the surging US dollar, and the symbolic 1.50 level is not far off. In the US, mixed data continues to make it difficult to anticipate what the Federal Reserve will do regarding a rate hike. Will the Fed press the rate trigger? In our opinion, there is a good chance of a “dovish rate hike”, and the US dollar could continue to make gains against the shaky pound.
In our latest podcast, we discuss if the NFP is enough for a Fed hike, drill down Draghi and more:
Further reading:
- For a broad view of all the week’s major events worldwide, read the USD outlook.
- For EUR/USD, check out the Euro to Dollar forecast.
- For the Japanese yen, read the USD/JPY forecast.
- For the kiwi, see the NZD/USD forecast.
- For the Australian dollar (Aussie), check out the AUD to USD forecast.
- For the Canadian dollar (loonie), check out the USD to CAD forecast.
