It was a dismal week for GBP/USD, which plunged almost 300 points. The pair closed the week at 1.5384, its lowest weekly close since early June. This week’s highlights are the PMI reports. Here is an outlook on the major events moving the pound and an updated technical analysis for GBP/USD.
The financial meltdown due to the Chinese stock market crash caused havoc in the currency markets as well, and the pound plummeted as panicky investors sought the safety of the US dollar. In the UK, GDP posted a gain of 0.7% and matched the forecast, but this wasn’t enough to stop the pound’s hemorrhaging.
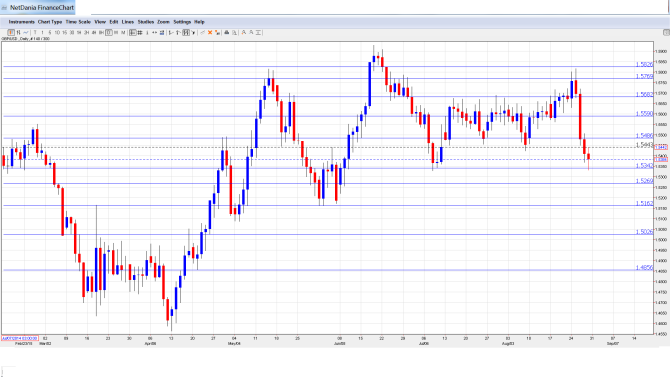
[do action=”autoupdate” tag=”GBPUSDUpdate”/]GBP/USD graph with support and resistance lines on it. Click to enlarge:
- Manufacturing PMI: Tuesday, 8:30. Manufacturing PMI has been steady in recent readings. The index rose slightly in July, with a reading of 51.9 points, which was within expectations. No change is expected in the August release.
- Net Lending to Individuals: Tuesday, 8:30. This indicator is closely linked to consumer spending and confidence, which are key drivers of the economy. The indicator improved to GBP 3.8 billion in July, well above the estimate of GBP 3.0 billion. Little change is expected in the August report, with a forecast of GBP 3.9 billion.
- Construction PMI: Wednesday, 8:30. The index dipped to 57.1 points in July, surprising the markets which had expected a stronger reading of 58.6 points. The forecast for the August report is 57.6 points.
- Services PMI: Thursday, 8:30. The week concludes with Services PMI, the third PMI report of the week. The index softened in July, coming in at 57.4 points. This was well off the forecast of 58.1 points. Little change is expected in the August release.
* All times are GMT
GBP/USD Technical Analysis
GBP/USD opened the week at 1.5674 and quickly touched a high of 1.5818. It was all downhill from there, as the pair dropped all the way to 1.5333, testing resistance at 1.5341 (discussed last week). The pair closed the week at 1.5384.
Live chart of GBP/USD: [do action=”tradingviews” pair=”GBPUSD” interval=”60″/]
Technical lines from top to bottom
With GBP/USD posting sharp losses last week, we begin at lower levels:
1.5825 was an important cap in November 2014.
1.5769 is the next resistance line.
1.5682 was an important cap in December 2014 and January 2015.
1.5590 continues to have a busy August. It has switched to a resistance role.
1.5485 was also broken during the pair’s sharp descent, and is currently an immediate resistance line.
1.5341 is a weak support level and could see further activity during the week.
1.5269 was an important support level in March.
1.5163 was an important support line in early June.
1.5026 has provided support since April.
1.4856 is the final support level for now.
I am bearish on GBP/USD.
The Chinese crisis exposed the weakness of the pound, which plunged last week after indecisive movement for much of the summer. The US economy remains on track, and any signs of a rate hike from the Fed will be bad news for the shaky pound.
In our latest podcast we explain what’s going on with EUR and China before previewing the big events ahead:
Further reading:
- For a broad view of all the week’s major events worldwide, read the USD outlook.
- For EUR/USD, check out the Euro to Dollar forecast.
- For the Japanese yen, read the USD/JPY forecast.
- For the kiwi, see the NZD/USD forecast.
- For the Australian dollar (Aussie), check out the AUD to USD forecast.
- For the Canadian dollar (loonie), check out the USD to CAD forecast.
