The pound only partially enjoyed the greenback’s weakness, making gains but not rallying like other currencies. The upcoming week features key inflation and employment figures, among others. Here’s an outlook for the events that will rock the pound, and an updated technical analysis for GBP/USD.
Contrary to the ECB, the BoE was much more dovish, and left the interest rate unchanged at 0.50%. This leaves the pound behind. Will the new inflation numbers force Britain to move on the rates? Let’s start:
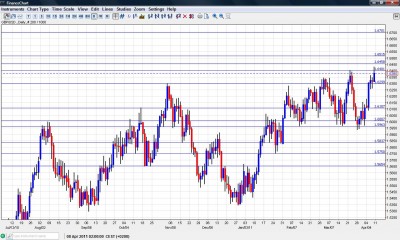
GBP/USD daily chart with support and resistance lines on it. Click to enlarge:
- Nationwide Consumer Confidence: Publication time unknown at the moment. The 1000 consumers surveyed for this important indicator disappointed last month – consumer confidence unexpectedly fell to 38 points, continuing a slide, blamed for the austerity measures. A small recovery is expected this time, to 40 points.
- BRC Retail Sales Monitor: Monday, 23:00. This unofficial “mini retail sales” release often reflects the official figure released more than a week later. According to BRC, it’s “two steps forward, one step backwards”. After each nice rise, a small fall comes. Last month saw a drop of 0.4%, so this time, growth is likely.
- RICS House Price Balance: Monday, 23:00. Although somewhat overshadowed by the BRC figure, this housing index is also significant. The balance between between areas witnessing rises in house prices and ones seeing drops was very unbalanced a few months ago, with the score being at -49%. Improvements have been seen since then, and we’re only at -26% now. It’s expected to tick up to -23% now.
- Inflation data: Tuesday, 8:30. Last month saw anther worrying acceleration in the consumer price index. CPI rose to an annual rate of 4.4%, getting further away from the 1-3% target. Most MPC members are still reluctant to act, given the fragile state of the economy. It’s now expected to remain unchanged at this pace. A rise to 5% will probably leave them no choice but to move on the rates. Core CPI is also predicted to remain unchanged at 3.4%. The Retail Price Index (RPI) which often better reflects what consumers feel, is expected to tick down from 5.5% to 5.4%, still very high. Another inflation indicator, PPI, leaped to 3.7%.
- Trade Balance: Tuesday, 8:30. This time, the important figure is overshadowed by inflation numbers, but a surprise here can have a strong impact on GBP/USD. After a few months of deepening deficits, it made a nice squeeze last time, to 7.1 billion. It’s now expected to widen again to 8.1 billion, weighing on the pound.
- Employment data: Wednesday, 8:30. Speaking about the fragile state of the economy, we still have an unemployment rate of 8%, and this isn’t expected to change for the month of February. The focus is usually on another employment figure – Claimant Count Change, which shows the change in the number the unemployed. Last month was somewhat positive, with a drop of 10,000 people claiming unemployment related benefits.A small drop is due now – 3100.
* All times are GMT.
GBP/USD Technical Analysis
Pound/dollar traded lower at the beginning of the week, but after it settled above 1.6110 (mentioned last week), the pair made a sharp move up, and even temporarily crossed the 1.64 line. It eventually closed at 1.6380.
Looking down, the region of 1.6280 – 1.63 now turns into support. This was a peak back in November and worked as resistance since then. It’s followed by 1.6110 which also switched roles and just proved its strength as support, preventing falls.
Further below, 1.60 continues to work as support, being a round number and also a past peak. It’s importance is diminishing.
Just below, the role of 1.5940 is stronger now, after it prevented a bigger fall. This is the key line on the downside now. Lower, the 1.5820 line, which served in both directions before the pair moved higher is a minor support line.
Not too far down, 1.5750 which is already a stronger line provides somewhat stronger support. An even stronger line is 1.5650. This was the upper border of wide range that GBP/USD traded before shifting to a higher range. There are more lines below, but they’re getting too far.
Looking up, 1.64, which was a peak on a previous failed attempt to break higher, is very minor and initial resistance. It’s closely followed by 1.6450, which was a swing high back in January 2010.
Further above, we find minor resistance at 1.6515, which provided support at the end of 2009. Much stronger resistance is found at 1.67, which capped the pair several times back then.
Even higher, 1.6877 was another notable peak and is the next minor resistance line. The final line is 1.7042, a peak reached in August 2009, and the highest level since the height of the financial crisis.
I remain bearish on GBP/USD.
The BoE is quite reluctant to act and it has good reasons to do so, as the economy is still fragile. With the political mess in the US behind us, the pair has room for falls, at least at the beginning of the week.
More on the pound – Elliott Wave Analysis of GBP/USD.
Further reading:
- For a broad view of all the week’s major events worldwide, read the USD outlook.
- For EUR/USD, check out the Euro/Dollar forecast.
- For the Japanese yen, read the USD/JPY forecast.
- For GBP/USD (cable), look into the British Pound forecast.
- For the Australian dollar (Aussie), check out the AUD to USD forecast.
- For the New Zealand dollar (kiwi), read the NZD forecast.
- For USD/CAD (loonie), check out the Canadian dollar
- For the Swiss Franc, see the USD/CHF Forecast.

