- Department of Labor reported positive unemployment claims for the previous week, adding pressure on gold prices.
- Gold price forecast remains bullish above the $1784.05 support level.
- Forex trading market participants may buy above the $1784.05 level to target the $1,801 and $1,809 levels.
Gold prices closed at $1781.20 after reaching a high of $1794.85 and a low of $1776.10. It traded sideways for the fourth consecutive session. However, the loss was limited as the precious metal moved in a tight range amid mixed market sentiments. The bullish power of the US dollar was weighing on the yellow metal, whereas the renewed coronavirus concerns stabilized the prices of gold. The gold price forecast remains bullish above the $1784.05 support level.
If you are interested in trading XAU/USD with forex robots, check out our guide.
Stronger US Dollar Weights on Gold Prices
The US Dollar Index continued its bullish momentum, rose for the 4th consecutive session, and reached the 93.58 level, its highest since November 2020. The US Treasury Yields on the 10-year note fell and continued their bearish momentum to 1.22%.
The strength of the US dollar could be attributed to the bets over an early policy tapering by the US central bank. The minutes from the July meeting of the FOMC revealed that Fed officials were mainly expecting to reduce stimulus support this year. Therefore, the greenback surged to its 9-month highest level on Thursday.
US Economic Events Underpins Gold at $1,775
The declining unemployment claims from last week also helped the US dollar gather strength against its rival currencies. On Thursday, the number of Americans claiming jobless benefits fell to its 17-month lowest level and pushed the greenback higher while adding pressure to precious metal prices.
On the data front, the Federal Reserve Bank of Philadelphia reported the Philly Manufacturing Index for August. It declined to 19.4 against the forecasted 23.2 and limited the downside momentum of gold. The Department of Labor reported positive unemployment claims for the previous week.
The US Jobless Claims fell to 348K against the predicted 362K and supported the US dollar. That added to a further loss in gold. In July, the CB Leading Index surged to 0.9% against the forecasted 0.7% and helped the US dollar, and dragged gold prices further to the downside. The mortgage delinquencies remained flat with expectations of 5.47%. Meanwhile, the rising coronavirus cases from the Delta variant added to the risk-off market sentiment that helped gold cap further losses on Thursday.
Centers for Disease Control Reports on Delta Variant
As per the latest data from the Centers for Disease Control, the Delta variant was present in about 98.8% of new patient samples collected between the 8th of August and 14th of August. Health experts said that the signs and symptoms of the Delta variant were different from previous strains as it also affects children, unlike other variants.
The rising fears of Delta variant and Delta Plus added to the concerns about the economic recovery and supported the yellow metal prices, which prevented further loss of precious metal.
Gold Price Forecast – Technical Levels
Support Resistance
1773.25 1792.00
1765.30 1802.80
1754.50 1810.75
Pivot Point: 1784.05
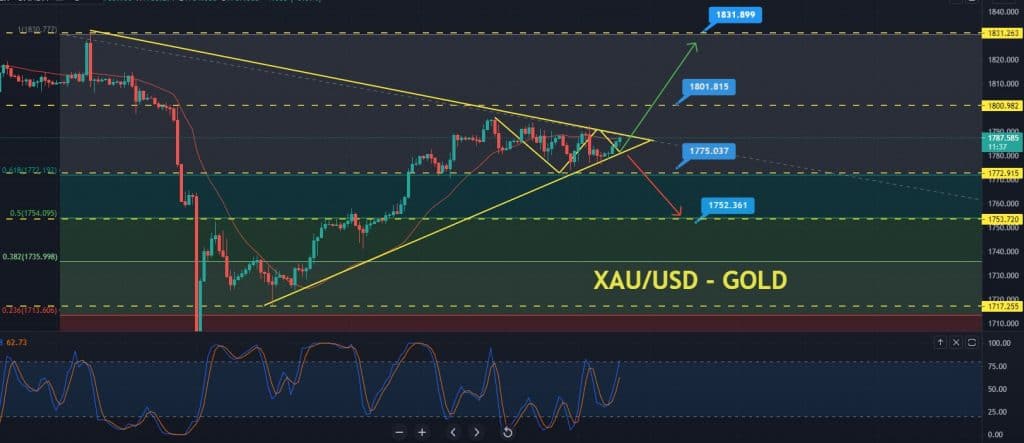
Gold Price Forecast – Daily Technical Analysis: Symmetrical Triangle
The gold price forecast remains bullish above the $1784.05 support level. On the 4-hourly timeframe, the upward trendline is extending support at the 1784.05 level. The closing of candles above this has the potential to trigger a bounce-off.
The metal extended trading with a neutral bias as it can not free itself from a symmetrical triangle pattern. This pattern provides resistance at 1,790, and a bullish breakout could extend the buying trend to 1,801 and 1,812 levels.
On the bearish side, the breakout of $1784.05 may provide the next support at a 61.8% Fibonacci retracement level of $1,773. Currently, the 50 day EMA (exponential moving average – red line) is also holding around $1787.05 levels, indicating resistance for a bullish trend in gold.
Besides, the leading indicator, Stochastic RSI, has entered the buy zone, holding at 77. Thus, the bulls are likely to take over the market above the $1784.05 level.
Therefore, the Forex trading market participants may buy above the $1784.05 level to target the $1,801 and $1,809 levels. Alternatively, selling trades can be seen on a bearish breakout below the 1784.05 level today. All the best!
Looking to trade forex now? Invest at eToro!
67% of retail investor accounts lose money when trading CFDs with this provider. You should consider whether you can afford to take the high risk of losing your money.