- The US Dollar Index, which measures the greenback’s value against the basket of six major currencies, fell sharply to 92.63.
- The gold price forecast remains bullish above an immediate support level of 1,809 level.
- Forex trading market participants may buy above the $1,809 level to target the $1,821 and 1,830 levels.
The XAU/USD closed at $1819.50 after reaching a high of $1821.90 and a low of $1785.20. Gold saw a sudden jump in its prices on Friday as it remained range-bound during the past few days. The gold price forecast remains bullish above an immediate support level of 1,809 level.
If you are interested in trading XAU/USD with forex robots, check out our guide.
Gold reached its 3-week highest level amid the broad-based weakness of the US dollar. The bullish trend was driven by the latest speech by Federal Reserve Chairman Jerome Powell.
Weakness in the US dollar Pushes Gold to a 3-Week High
On Friday, the US Dollar Index that measures the greenback’s value against the basket of six major currencies fell sharply to 92.63. Thus, it weighed on the greenback. The US Treasury Yields on a 10-year note also dropped and reached as low as 1.3% after rising continuously for the previous three sessions.
The rally in gold prices on the last day of the week was due to the weakness of the US dollar. The greenback came under pressure when the chairman of the Federal Reserve, Powell, failed to provide any hint on the timeline for tapering asset purchases at the Jackson Hole symposium.
Jackson Hole Symposium Updates & Impact on Gold
Powell stated that the US economy is on the right track but is still vulnerable to risks posed by the coronavirus pandemic. The Fed chair said that a further spread of the pandemic from the Delta variant had reduced his previous stance. Previously, he was of the view that tapering could begin by the end of this year.
He added that the substantial further progress test had been met for inflation, and there had also been clear progress toward maximum employment. However, the Fed will be closely watching the incoming data and evolving risks to decide on tapering.
Quick Update on Treasury Securities
According to Powell, even if asset purchases end, the elevated holdings of longer-term securities will continue to support accommodative financial conditions. Since March 2020, the Federal Reserve has continuously bought about $80 billion in Treasury securities and $40 billion in agency mortgage-backed securities every month.
That’s being done to support the economy of the United States through the pandemic-induced damage to the economy. Another measure the central bank took was to reduce its interest rates to a record low of near-zero and 0.25%.
The central bank’s stimulus program has been blamed for aggravating price pressures in the United States. Furthermore, investors believed that the Fed would provide hints about tapering stimulus support at a Jackson Hole symposium. The Fed maintained its stance on tapering and failed to provide any such hints. This eventually added weight to the US dollar and pushed the yellow metal higher on board.
Quick Economic Data Review
At 17:30 GMT, the Core PCE Price Index from July remained flat with expectations of 0.3% on the data front. The Goods Trade Balance from July showed a deficit of-86.4B against the expected-90.8B and further capped gains in gold prices.
The personal income from July surged to 1.1% against the forecasted 0.2% and supported the US dollar. In July, personal spending dropped by 0.3% against the forecasted 0.4% and weighed on the US dollar.
The Prelim Wholesale Inventories dropped to 0.6% against the anticipated 1.0% in July and capped upside momentum in the yellow metal. At 19:00 GMT, August’s Revised UoM Consumer Sentiment declined to 70.3 against the projected 70.9 and weighed on the US dollar. The Revised UoM Inflation Expectations in August remained flat with the previous at 4.6%.
Gold Price Forecast – Technical Levels
Support Resistance
1820.21 1821.96
1819.38 1822.88
1818.46 1823.71
Pivot Point: 1821.13
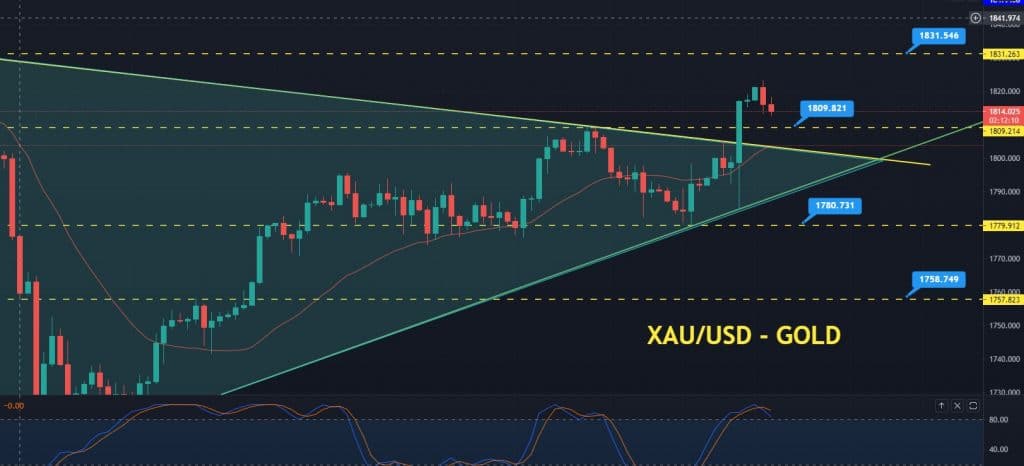
Gold Price Forecast – Symmetrical Triangle Breakout
Gold price forecast remains bullish above an immediate support level of 1,809 level. In the 4-hourly timeframe, gold has violated the symmetrical triangle pattern at the 1,809 level. The closing of candles above this level supported a bullish trend in gold on Monday.
On the bullish side, the breakout of the 1,820 resistance level could extend the buying trend to the 1,831 level. On the bearish side, the support stays at 1,809. Moreover, the breakout of the support level at 1,809 could trigger sharp selling until 1,780.
Recently, the 50 day EMA (exponential moving average – red line) held at the $1794 level, supporting gold’s bullish trend. Moreover, the leading indicator, Stochastic RSI, stays above 50, demonstrating a bullish trend in gold.
Therefore, the Forex trading market participants may buy above the $1,809 level to target the $1,821 and 1,830 levels. Alternatively, selling trades can be seen below the $1,809 level today. All the best!
Looking to trade forex now? Invest at eToro!
67% of retail investor accounts lose money when trading CFDs with this provider. You should consider whether you can afford to take the high risk of losing your money.