- The XAU/USD is bullish as long as it stays above the channel’s support.
- The US data should bring some volatility later today.
- The flag pattern is seen as a bearish formation.
The gold price extended its growth as the USD depreciated versus its rivals in the short term. It’s trading at $1,979, below today’s high of $1,985.
–Are you interested in learning more about STP brokers? Check our detailed guide-
The bias is bullish in the short term, but how it reacts after the US data remains to be seen. Today, the fundamentals should drive the rate. Gold extended its growth also because the US Final GDP rose by 2.6% less versus 2.7% growth, while Unemployment Claims came in at 198K versus 196K expected.
Today, the Japanese, UK, Chinese, and Eurozone data came in mixed. The Eurozone CPI Flash Estimate reported a 6.9% growth versus the 7.1% growth expected, while Core CPI Flash Estimate surged by 5.7%, matching expectations.
Later, the Canadian GDP and the US economic figures should have a big impact on the XAU/USD. The US Core PCE Price Index is a high-impact event that could shake the price.
The indicator is expected to register a 0.4% growth versus the 0.6% growth in the previous reporting period. Poor US data could help the yellow metal to extend its growth.
Gold Price Technical Analysis: Bearish Formation
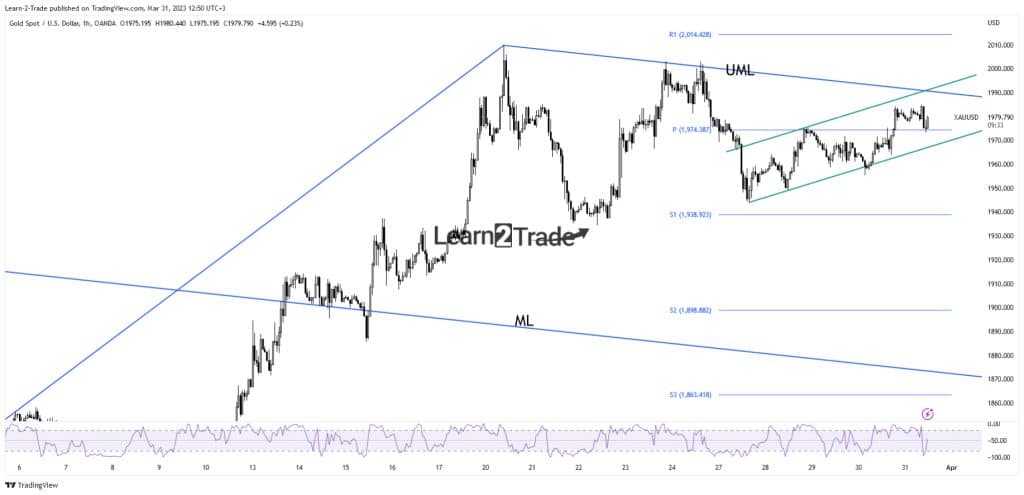
As you can see from the hourly chart, the rate climbed within an up-channel pattern. This represents a bearish formation. Still, the pattern is far from being confirmed.
–Are you interested in learning more about forex robots? Check our detailed guide-
The bias is bullish in the short term as long as it stays above the uptrend line. It has retested the weekly pivot point of 1,974, confirming its breakout.
The descending pitchfork’s upper median line (UML) is a dynamic resistance. A larger growth could be activated only after taking out this upside obstacle.
False breakouts through the upper median line (UML) and dropping below the channel’s downside line activate a downside movement (corrective phase).
Looking to trade forex now? Invest at eToro!
68% of retail investor accounts lose money when trading CFDs with this provider. You should consider whether you can afford to take the high risk of losing your money
