- Crossover visible on long term charts.
- Confirmations pending before the trend can change.
IOTA prices show signs of breaking out on the long term charts, but it is still not confirmed as the crossover has happened but confirmations are still few places away. Even on the short term charts, there’s a breakout visible but without confirmations.
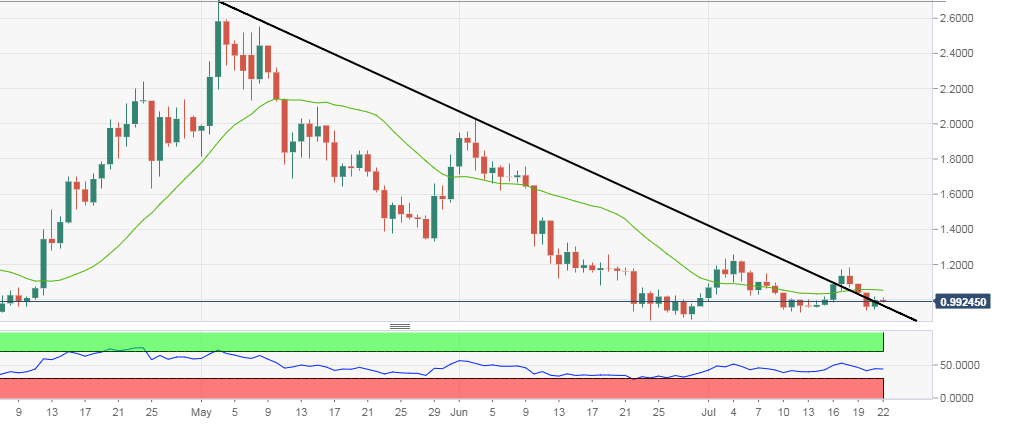
IOT/USD is down about a percent at $0.99, just below psychologically important mark of $1.00. On the daly chart IOT crossed and closed above the descending trendline on Saturday, but just the crossover wouldn’t yet be termed as a breakout until it manages to cross past important resistance marks of $1.18-$1.26.
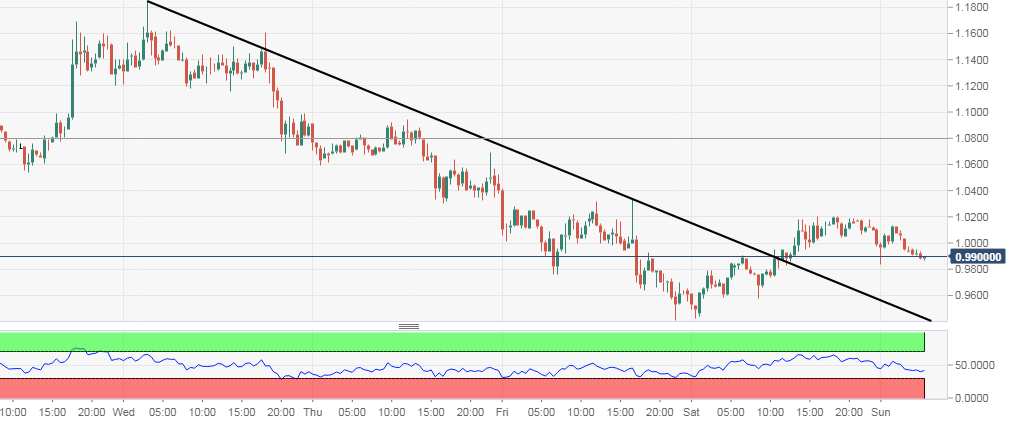
On the short term 30-minute chart too it has broken out but confirmations would occur on the successful crossover of $1.03-$1.07 range for the short term trend to remain up.
IOT/USD daily chart:
IOT/USD 30-minute chart: