- KNC/USD is up 15% after breaking through the $1.45 resistance level and setting a new two-year high.
- Kyber Network is reacting positively to Ethereum payouts for staking KNC, an upcoming launch.
Kyber has done it, it has established a new two-year high at $1.59 on Coinbase and doesn’t seem to be slowing down. The daily MACD has now crossed bullish and the trading volume is increasing. KNC is ranked 37th by market capitalization with a $270 million mcap. Throughout 2020, KNC has experienced an explosion in trading volume from an average of $4 million per day to more than $60 million and a peak of $150 million.
KNC/USD daily chart
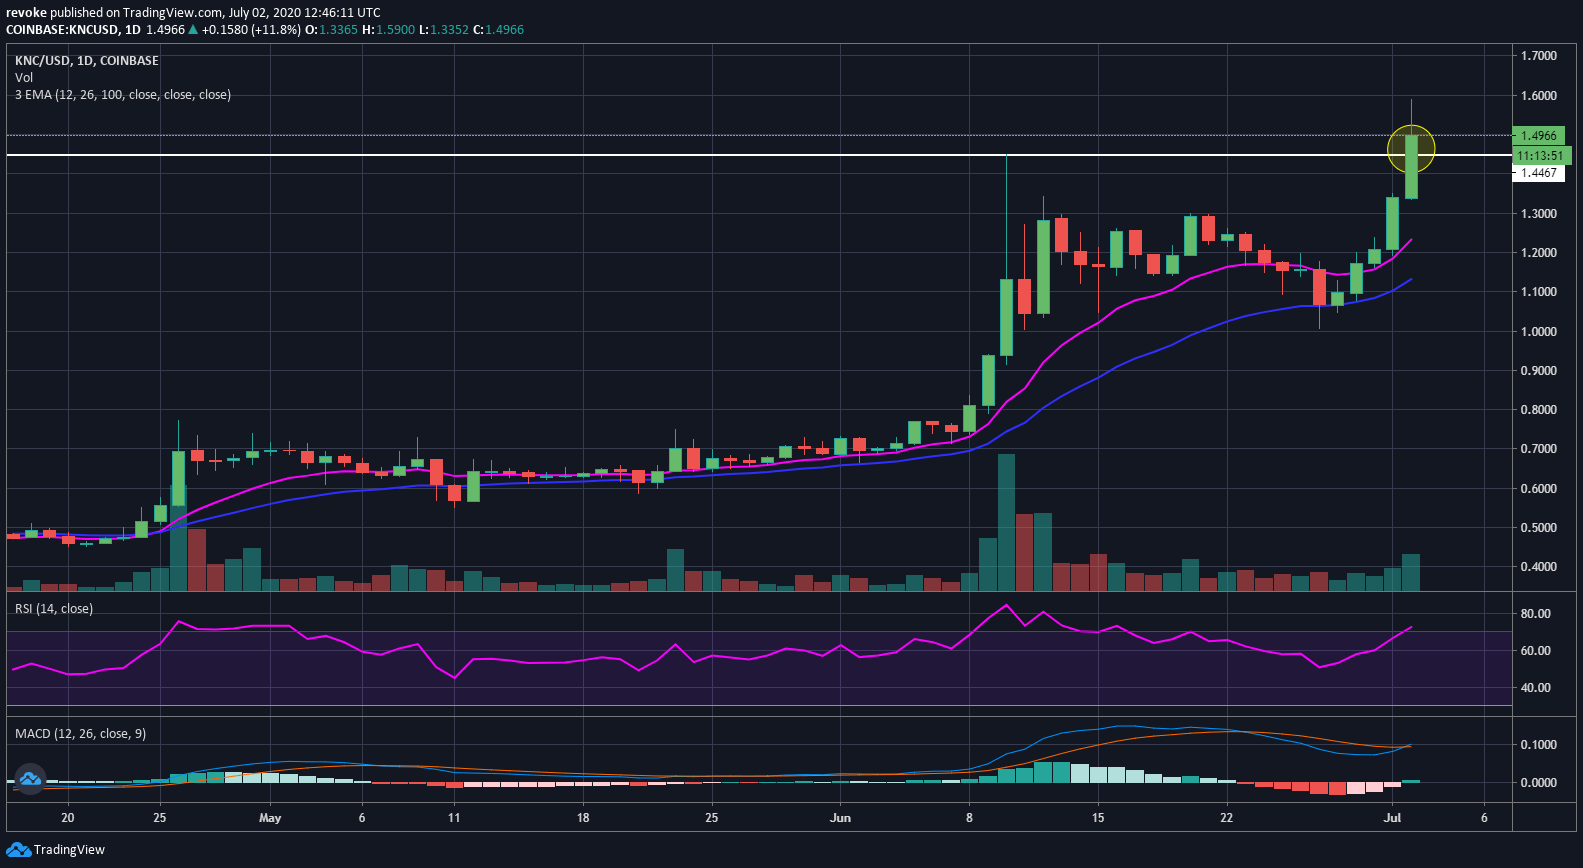
Clearly KNC is extremely bullish, however, the daily RSI, which is slightly overextended, could pose a threat for the buyers in the short-term. The most important task for Kyber is to close above $1.45 which was the last resistance level.
KNC/USD 4-hour chart
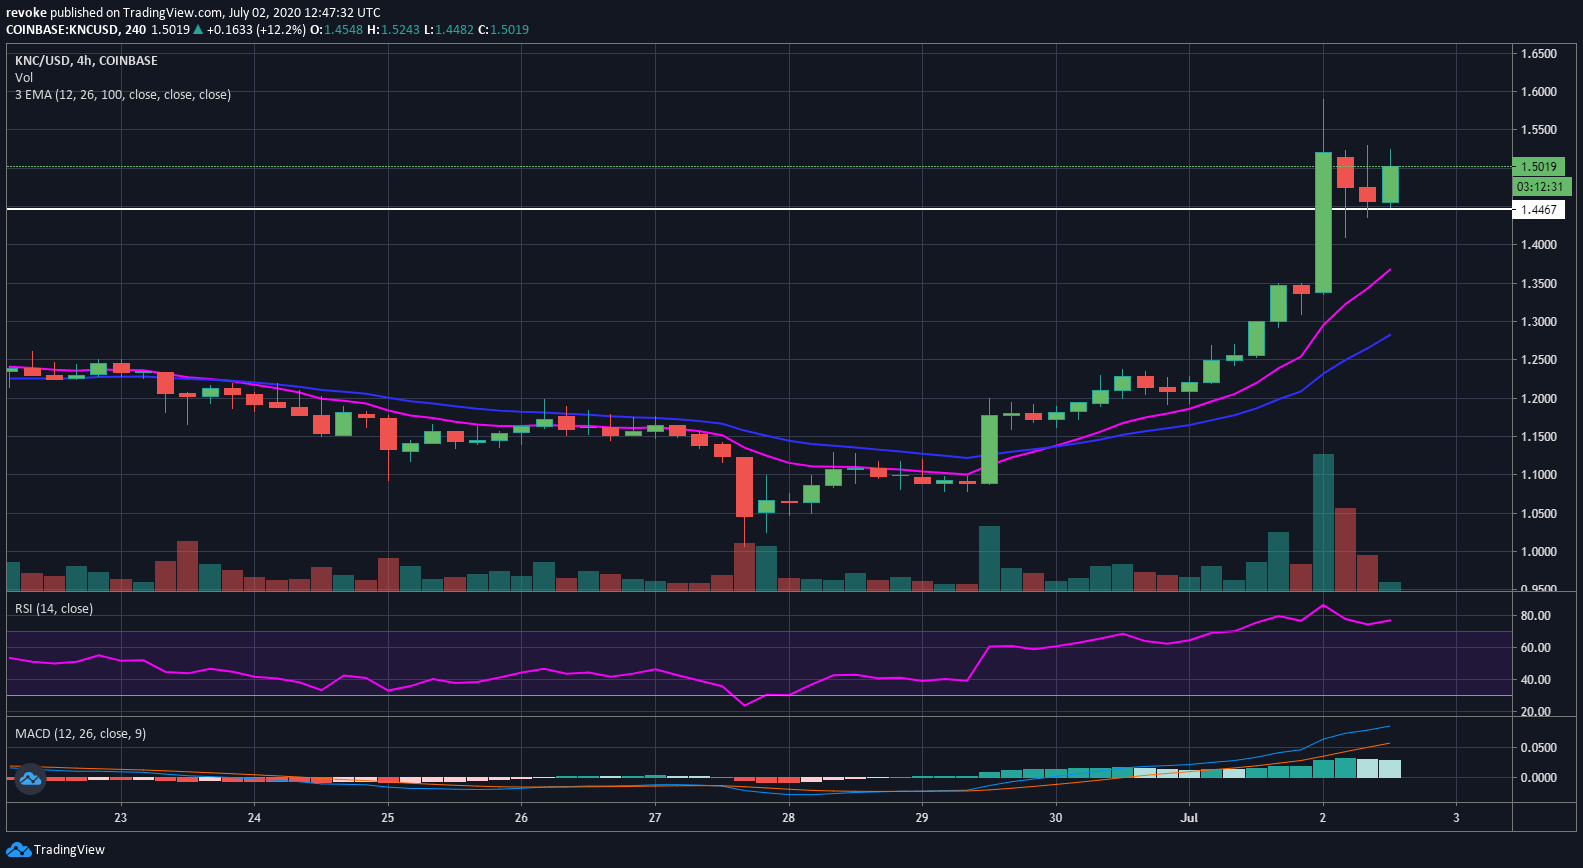
This chart looks really healthy with a few hours of consolidation and what looks like to be the next leg up. The RSI is still overextended and the bulls might need to see a bit more consolidation. The 12-EMA can be used as a support level in the near future, currently it’s down at $1.36.
