- LINK/USD is currently trading at $4.77, really close to the 2020-high established on April 3.
- Link has formed two consecutive bullish reversal candlesticks on the daily chart.
LINK is changing hands at $4.76 at the time of writing after yet another bounce from $4.5. On June 24, LINK/USD dropped to $4.487 but recovered on the same day. Something similar happened on June 25 indicating that bulls have a lot of buying power and are willing to buy the dips.
LINK/USD daily chart
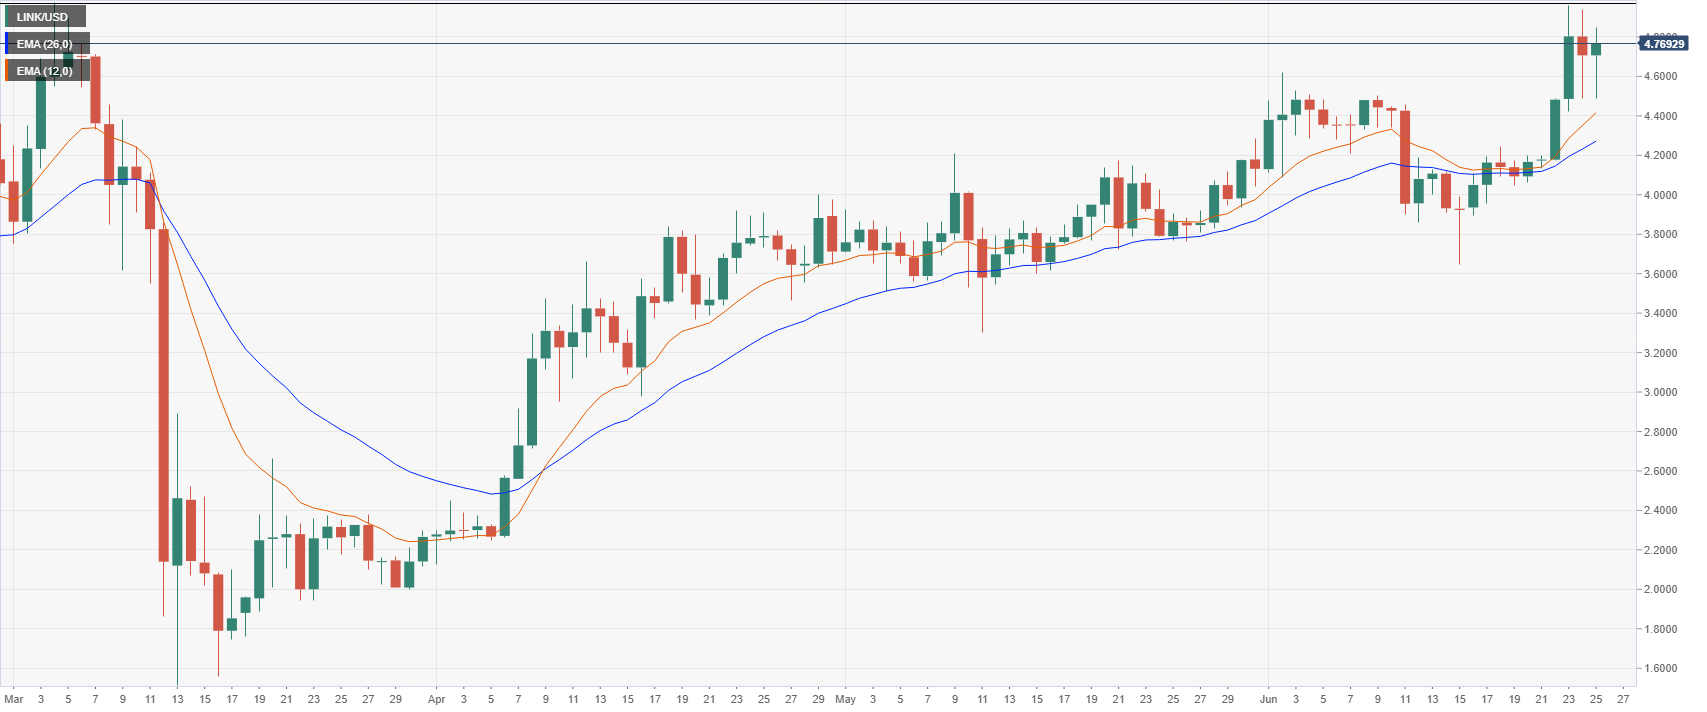
The daily chart is clearly in favor of the buyers and LINK continues trading way above the daily 12-EMA or the 26-EMA. After a brief pause around $4, LINK has continued with its long-term uptrend and it’s getting ready to crack $5 next. Bulls are only facing the $4.97, 2020-high, and $5 as resistance.
LINK/USD 4-hour chart
-637286988739931709.png)
The 4-hour chart is still in an uptrend despite the last two volatile crashes. If LINK needs to consolidate further, bulls can use the 12-EMA at $4.68 for support. The most important level to hold is at $4.48 to keep the uptrend going.
