- Breakout on one chart while support on another.
- Recipe for a continued, steady run up.
Litecoin bulls have a great technical set up to cheer for as the price continues to move up in a slow and steady manner after a breakout from a descending trendline and now continues to trade above anothe trendline, in a sign of more gains to follow.
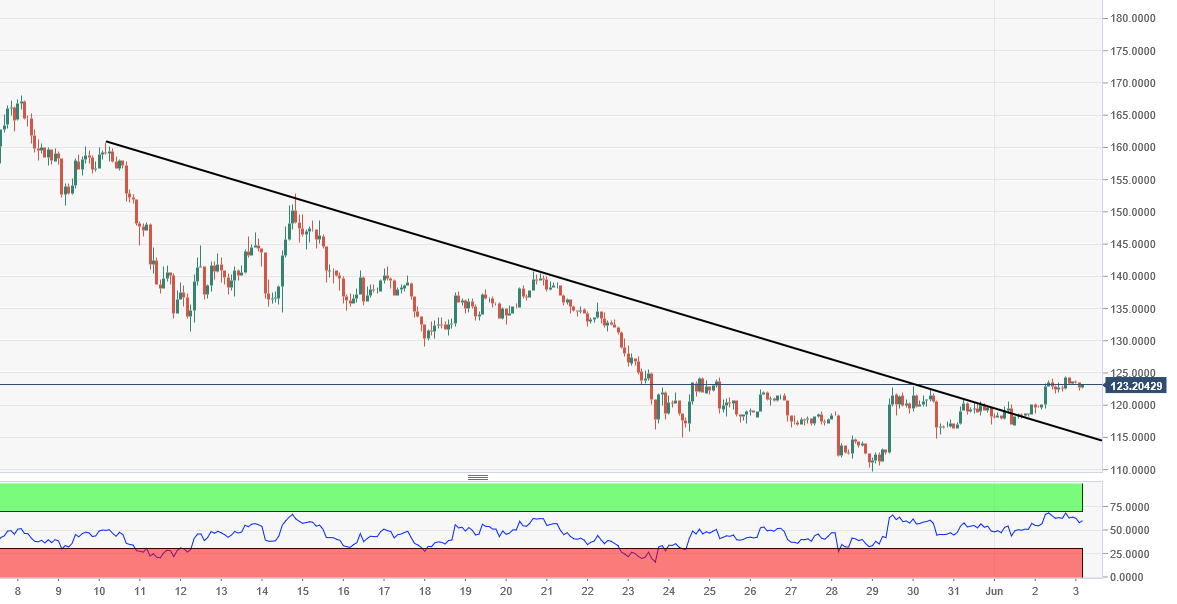
LTC/USD is down 0.4 percent on the day at $123.145, trading in a narrow band of $122.29 – $123.884 in a thinly traded low volatile weekend trading. On the 120-minute chart, LTC broke out of a descending trendline that has been acting as a tough resistance since the start of last May and continues to rise up in a slow and steady manner after this breakout.
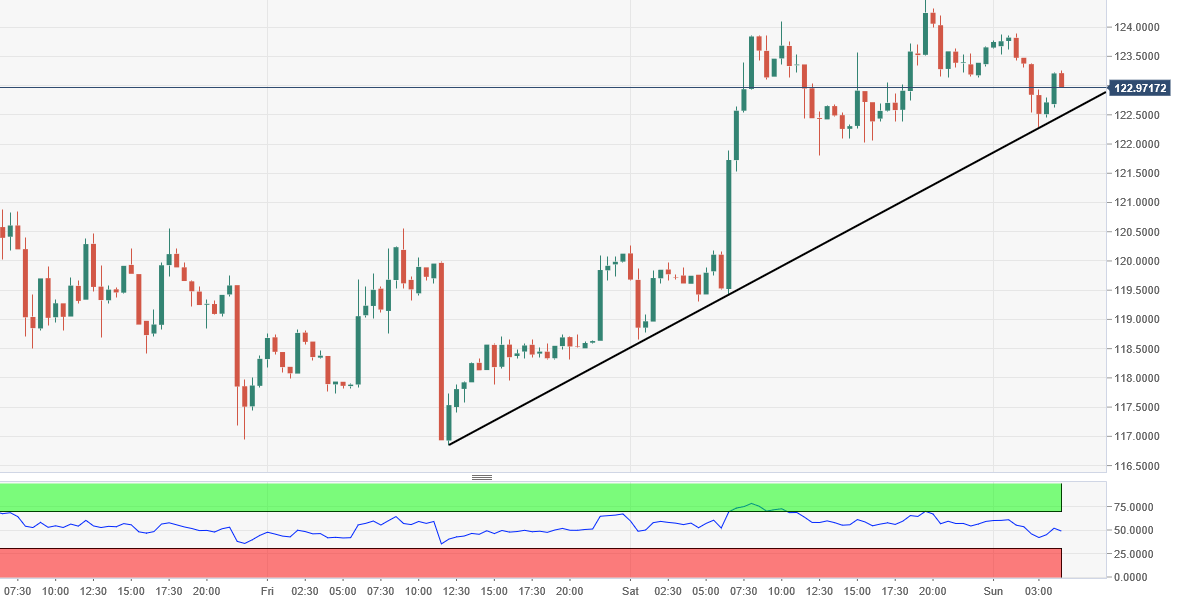
On the 30 minute charts, the price is taking support on the rising trendline too. From long term perspective immediate resistance is now placed around $127, 23.6 percent fibonacci retracement of the entire fall from May high.
LTC/USD 120-minute chart:
LTC/USD 30-minute chart: