- Litecoin retreated from the highest level since May 2018.
- LTC/USD is vulnerable to further losses amid the correction from the overbought territory.
Litecoin’s fate has changed as the cryptocurrency slipped into a red zone while Bitcoin and all major altcoins managed to recover in recent 24 hours. The 5th largest asset with the current market capitalization of $8.3 billion has lost about 2% since this time on Wednesday, though it is still more than 20% higher since the beginning of the week. Obviously, an unsuccessful attempt to break above $140.00 triggered the downside correction. At the time of writing, LTC/USD is changing hands at $134.00
Litecoin’s technical picture
From the long-term perspective, a long-legged doji followed by a red candle on a daily chart bodes ill for LItecoin bulls. This pattern implies that the market is ready for an extended correction from the overbought levels with the first aim at psychological $120.00, strengthened by SMA50 (Simple Moving Average) 4-hour chart and SMA200 1-hour. Once it is cleared, the sell-off is likely to gain traction with the next focus on $110.00 handle (23.6% Fibo retracement for a significant downside move from December 2017 high).
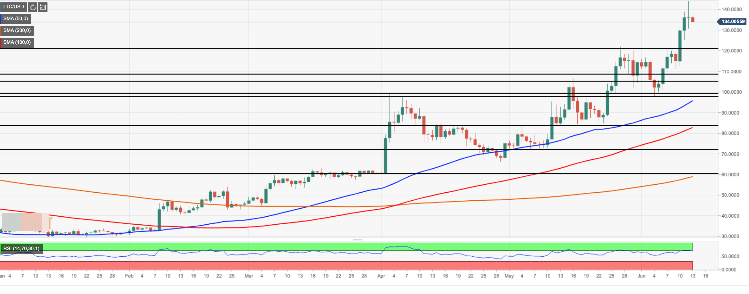
On the upside, a recovery above $140.00 will allow for an extended bullish movement with the next aim at Wednesday’s high of $144.16. The next upside target is seen at $160.00. This is a major barrier created by 38.2% Fibo retracement at $160.00.
LTC/USD, 1-day chart