- LTC/USD bulls took control of the market for the second straight day.
- The 20-day Bollinger jaw has narrowed, indicating decreasing price volatility.
LTC/USD daily chart
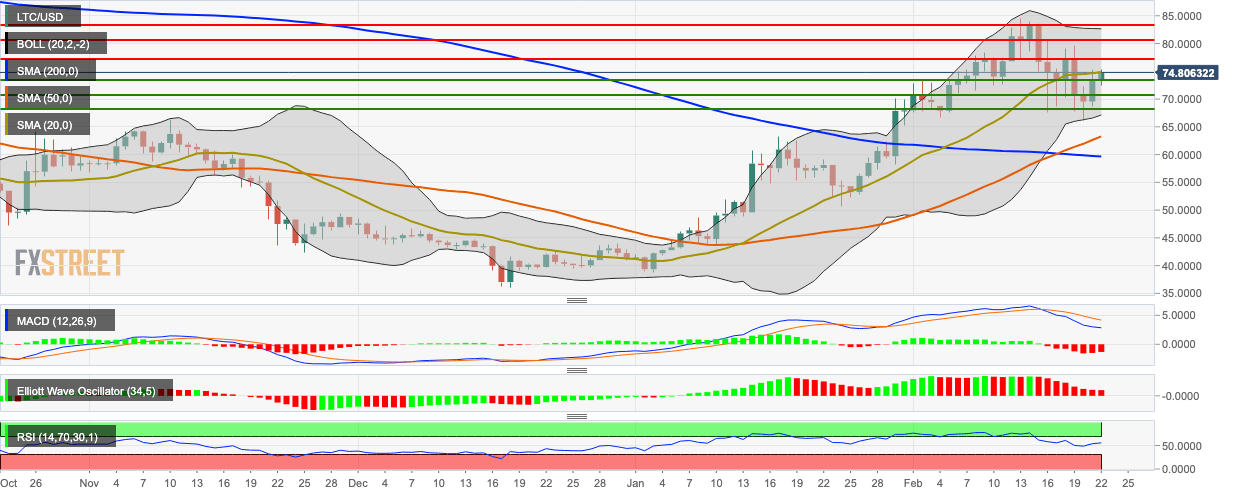
LTC/USD bulls took control of the market for the second straight day as the price went up from $73.40 to $74.50 in the early hours of Saturday. The SMA 20 acts as immediate market resistance, which the bulls will need to conquer to continue the upward movement. After breaking past SMA 20, the bulls should aim to go past the $77 resistance level to get back into the $80-zone. Both the MACD and Elliott Oscillator shows that while the overall market sentiment is still bearish, the recent buyer action has definitely inhibited the downward momentum. The 20-day Bollinger jaw has narrowed, indicating decreasing price volatility.
