- LTC/USD is currently dancing with $95.00 while technical indicators are showing the dominance of bears in the medium-term.
- The listing will take place in a couple days and will widen the scope of the Litecoin community when trading.
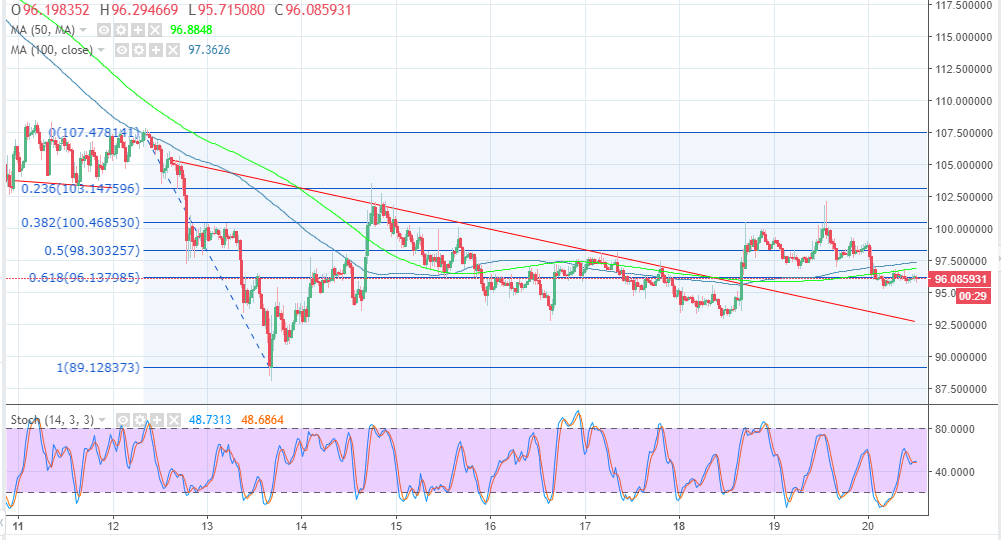
Litecoin price tested the critical resistance at $100 but rising selling pressure led to lower corrections. The price smashed through the support provided by the 50% Fib retracement level with the previous swing high of $107 and a low of $89.2. The crypto is currently dancing with $95.00 while technical indicators are showing the dominance of bears in the medium-term.
Anyway, we will come to that later, in the meantime, LTC derivatives have landed a listing on a London-based exchange platform operated by, Crypto facilities. The exchange already provided futures trading for Bitcoin, Ethereum, as well as Ripple and the new addition, will expand their portfolio for the customers. Moreover, the customers can now long and short the original asset and not have to own LTC. The firm says that futures trading assists the customer in managing risks when trading as opposed to trading on other exchanges. The CEO of Crypto Facilities, Tom Schlaefer commented saying:
“We believe our LTC-dollar futures contracts will increase price transparency, liquidity and efficiency in the cryptocurrency markets,”
The listing will take place in a couple days and will widen the scope of the Litecoin community when trading. Moreover, they now have a way to trade while managing risk better than trading on traditional crypto exchanges.
Litecoin price analysis
Litecoin price upside is currently limited by the 50% Fib retracement level with the previous swing high of 107 and a low $89.2. The 50 SMA and the 100 SMA on the 30′ minutes chart will also prevent gains towards the short-term resistance at $99.00 respectively. However, the critical resistance and current upper supply zone is at $100.00. An upside breakout is also expected which could have LTC/USD attack the serial resistance at $102; the stochastic on the same chart shows bullish signs. Other support areas on the lower side include $92.5 and $89.2 (previous low).
LTC/USD 30′ chart