- Litecoin price is testing key support at $122, pending a downside breakout.
- The 50 SMA has crossed below the 200 SMA which could signal for more selling entries in the near-term.
Litecoin price joined the other top ten cryptocurrencies to record considerable gains over the weekend. The crypto corrected above the previous breakout point at $122, which led to further gains above $125 but the upside was capped below $128 key resistance zone.
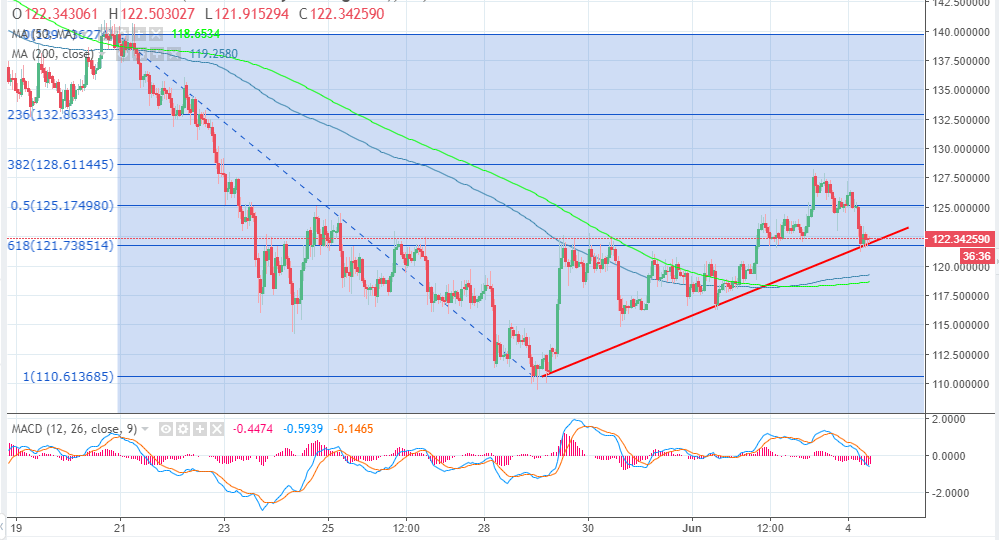
At the time of writing, LTC/USD is trading at $122.33 after sustaining slight declines from highs of $127.58 (traded on Sunday). The short-term support highlighted by the 50% Fib retracement level with the last high of $139.7 and a low of $110.5 close to $125 failed to hold the price during the declines. However, Litecoin price is currently supported by the 61.8% Fibo which also coincides with the bullish trendline.
The bulls are fighting to keep the price above retracement support, although LTC/USD is on the verge of another downside movement. Furthermore, the price is above the moving averages on the 1-hour chart. The 50 SMA has crossed below the 200 SMA which could signal for more selling entries. In addition to that, the MACD is moving further into the negative levels confirming the prevailing selling pressure in the near-term. The zone at $120 – $117 should be able to stop declines in the event of a downside breakout below the current support at $122.
LTC/USD 1-hour chart