- LTC bears fight back charge amid fresh selling-wave across crypto space.
- The coin looks to retest nine-month lows of $ 43.64.
The sixth most widely traded cryptocurrency – Litecoin (LTC/USD), with a market capitalization of $ 3.00 billion, is down for the sixth day in a row, tracking the bearish momentum across the crypto markets. The coin tried several attempts to extend the recovery from nine-month lows of 43.64, but in vain, as the bears refuse to give up their reigns this Saturday. At the press time, the price trades near daily lows of 46.47, down 1.60% on the day and 6.20% over the last 24 hours.
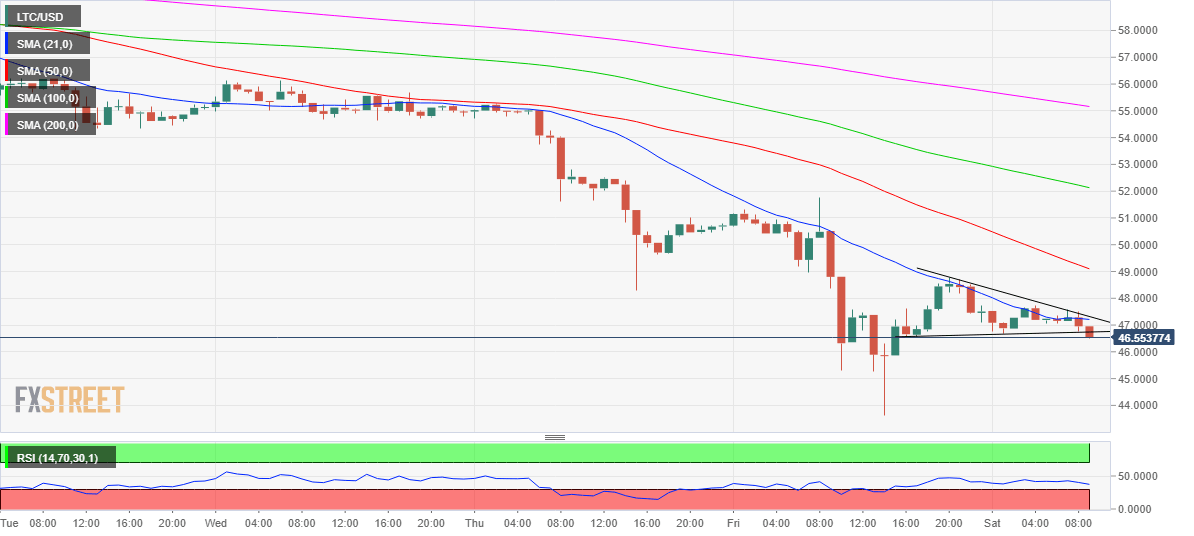
LTC/USD 1-hour chart
As observed on the hourly sticks, LTC/USD has confirmed a descending triangle breakdown, with the immediate support now seen at the 46 level (round number). A breach of the last, the selling pressure is likely to intensify, bringing the pattern target near 44.60 in play. On a failure to sustain above the last, the price could fall further to test the nine-month lows on the 43 handle. The further downside could be also justified by the hourly Relative Strength Index (RSI), which is seen heading further south, near 42 levels.
Should the bulls manage to defend the 46 handle, a minor comeback towards the 21-hour Simply Moving Average (HMA) and pattern trendline resistance near 47.30 cannot be ruled.
LTC/USD Levels to watch
