- Litecoin Price Prediction is bearish as the SuperTrend indicator sends a sell signal.
- A session closure below the $170 mark will push LTC below towards the 100 SMA.
- The MACD indicator accentuates Litecoin’s bearish thesis.
Litecoin price has been stuck in market indecision in most trading sessions on Wednesday as seen on the four-hour chart. A bullish doji stick characterised the early Asian trading sessions that saw bulls pull LTC/USD back from an intra-day low at $162. Similarly, the second session was characterised by a bearish doji stick that saw the bears pull the price back from an intra-day high at $171.
At the time of writing, LTC is trading in the green at $170 as bulls focus on regaining support above the $170 psychological level.
- Are you interested in trading Litecoin? This guide on best crypto exchanges might be helpful.
Litecoin Price Correction May Continue In Near Term
The LTC/USD price prediction for the short-term is significantly bearish. Realise that the SuperTrend Indicator changed from green to red and flipped above the price, this sending a bearish crypto signal on the four-hour chart this morning. This indicator follows the trend of an asset like the moving averages, but as it overlays the chart, it calculates the volatility, thereby sending buy and sell signals. Note that as long as the SuperTrend moves above Litecoin’s price, the bearish leg will continue.
LTC/USD Four Hour Chart
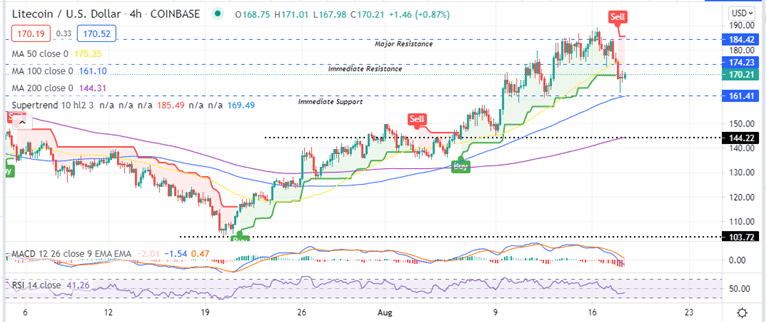
Moreover the downward movement of the Moving Average Convergence Divergence (MACD) indicator below the signal line as it crosses the zero line into the negative region accentuates this bearish thesis.
Moreover, On-chain metrics from In/Out of the Money Around Price (IOMAP) model by IntoTheBlock’s Litecoin’s immediate resistance embraced by the 50 period Simple Moving Average (SMA) around $174 is significant enough to curtail any attempts to push LTC upwards. It belongs to the $169 and $174 investor cluster where roughly 161,000 addresses previously bought approximately 2.08 million LTC.
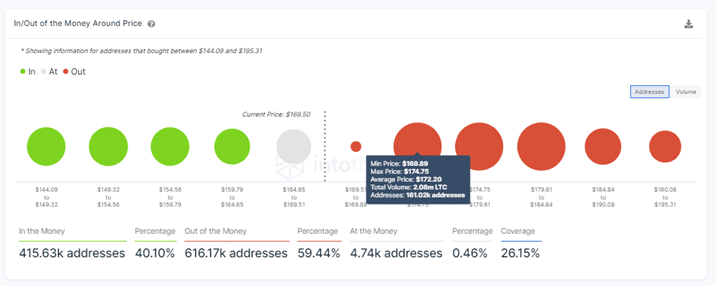
Compared to the immediate support at $161, it is relatively weak. It is within the $159 and $164 price range where 73,000 addresses previously bought 1.04 million LTC. However, a fall below this level would meet robust support as indicated by the IOMAP
A look at the day Ahead For LTC
One of the key levels to watch for the day ahead is the $174 resistance level where the 50 SMA sits. If LTC closes the session above this level, it would be an indication that the bullish leg will be re-started. The bullish momentum will be fully confirmed if the LTC price breakout above the major resistance at $184.
On the flipside, a session closure below the $170 psychological level will indicate that the bears are still in control of the Litecoin price and the next key level to watch would be the $161 support wall below today’s low at $162.
In the meantime, the sideways movement of the Relative Strength Index (RSI) indicator brings forth the possibility of a sideways price action taking root in the near term.
Looking to buy or trade Litecoin now? Invest at eToro!
Capital at risk
