- Litecoin price gains 15.77% for the best daily gain since January 3.
- Daily Relative Strength Index (RSI) not showing a bearish momentum divergence.
- Swiss SIX exchange-traded product, LITE, increases spotlight on LTC.
Litecoin price successfully broke out from a symmetrical triangle pattern on April 5 with a 9.5% gain. It printed a new rally high today at $262.98, just short of the 61.8% Fibonacci retracement of the 2017-2018 bear market at $268.06. The bullish LTC thesis sees higher levels moving forward.
Litecoin price faces limited resistance based on IOMAP figures
The successful retest of the triangle breakout on April 7 was a clear signal to speculators that LTC was primed to test the 2021 high at $247.00. Yesterday’s daily close above the February high was a new signal to speculators that LTC’s 2021 rally was set to continue.
The IntoTheBlock In/Out of the Money Around Price (IOMAP) data exposes almost no resistance between $249.73 and $287.07, projecting a test of the symmetrical triangle measured move target of $292.20. Conversely, there is a significant source of support between $227.39 and $234.72, where 69.91k addresses bought 4.17 million LTC.
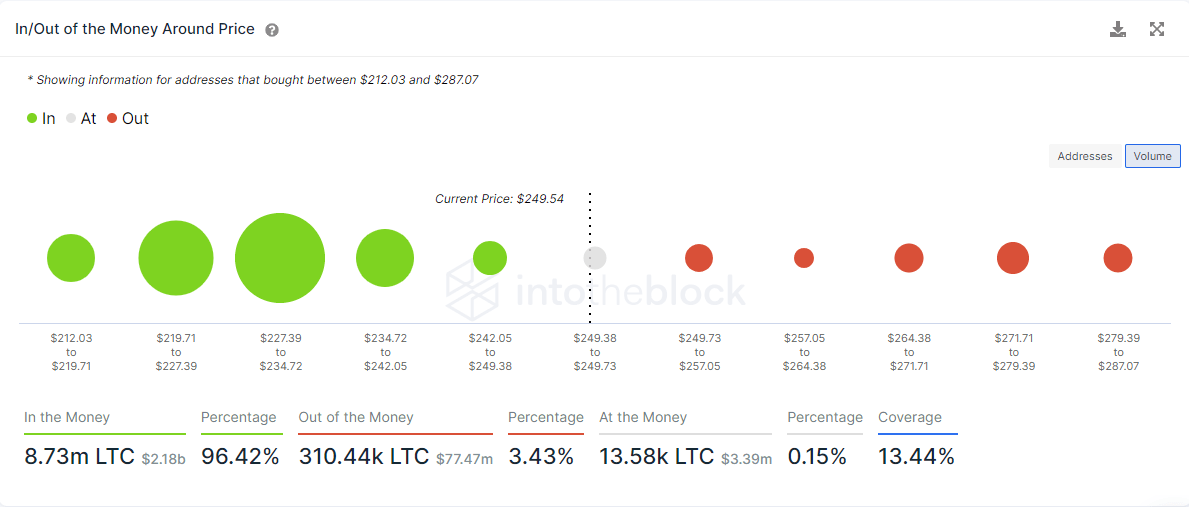
ETH IOMAP chart
In an FXStreet article on April 1, it was projected that LTC was ready for a 40% gain from the symmetrical triangle breakout level, and that outlook remains the thesis today.
Some resistance may occur at the 61.8% retracement of the 2017-2018 bear market at $268.06, but IOMAP data indicate that the opposition will be short-lived. Instead, the current bullish outlook targets $292.20 as a valid profit target, a gain of 38%. There is a chance that the rally will reach the 78.6% retracement at $334.88 if volume underpins the rally.
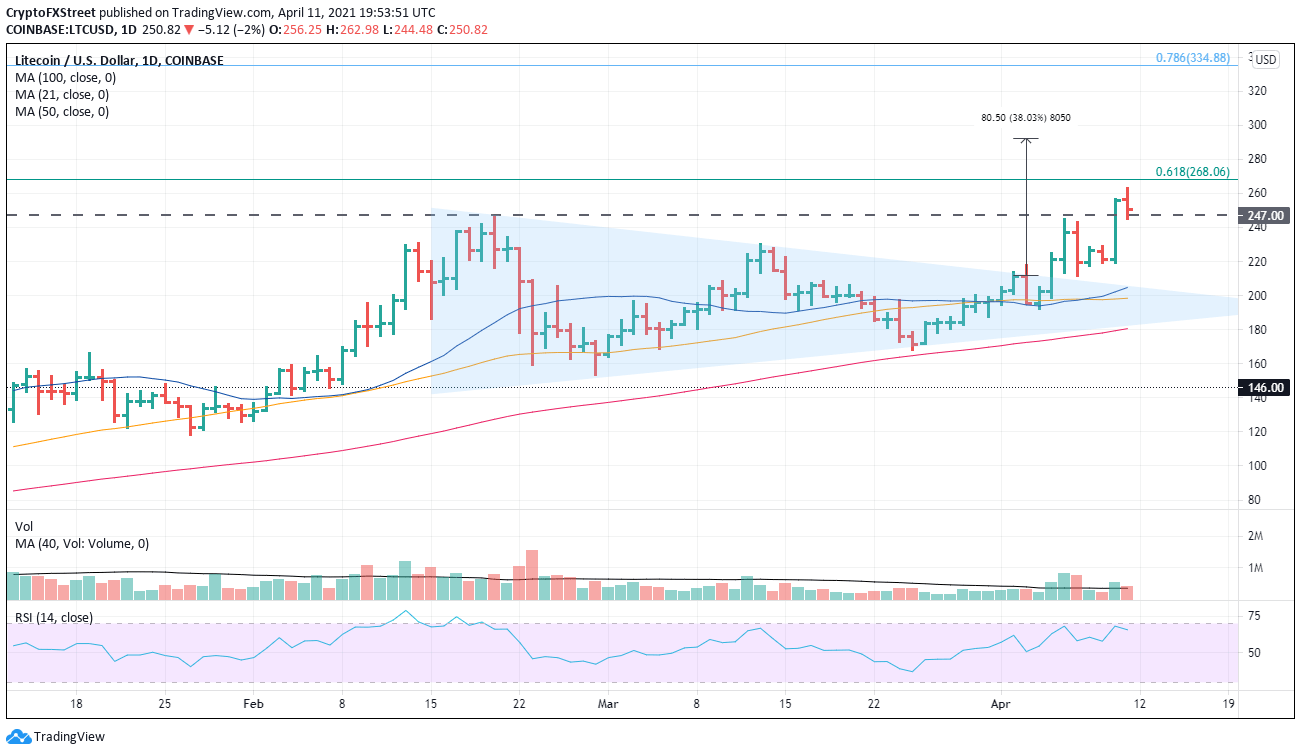
LTC/USD daily chart
Yes, the technicals and the data paint a bullish picture, but things could change very quickly, maybe sparked by a general sell-off in the cryptocurrency complex. If that occurs, downside targets are the 21-day simple moving average (SMA) and the 50-day SMA at $204.77 and 198.45, respectively.
Speculators should mark the convergence of the triangle’s lower trend line at $181.90 and the 100-day SMA at $180.61 as the next level of support.
