- Litecoin price stalls again at the 78.6% Fibonacci retracement of the 2017-2018 bear market.
- Ascending Channel governing Litecoin price action since the fall of 2020.
- IOMAP data displays minimal resistance until $350.00.
Litecoin price failure today at the critical Fibonacci level is the second time since mid-April and lowers the odds that LTC can overcome the resistance and launch a substantive test of the all-time high at $420.00.
Litecoin price in need of a dominant catalyst
The IntoTheBlock In/Out of the Money Around Price (IOMAP) data shows almost no resistance from the current Litecoin price until $350.24, which is slightly beyond the 78.6% retracement level mentioned above.
Likewise, Litecoin shows limited support until a cluster between $259.85 to $269.27. A total of 103.49k addresses bought 3.39 million LTC at an average price of $265.07, which is slightly below the 61.8% retracement of the 2017-2018 bear market at $268.03.
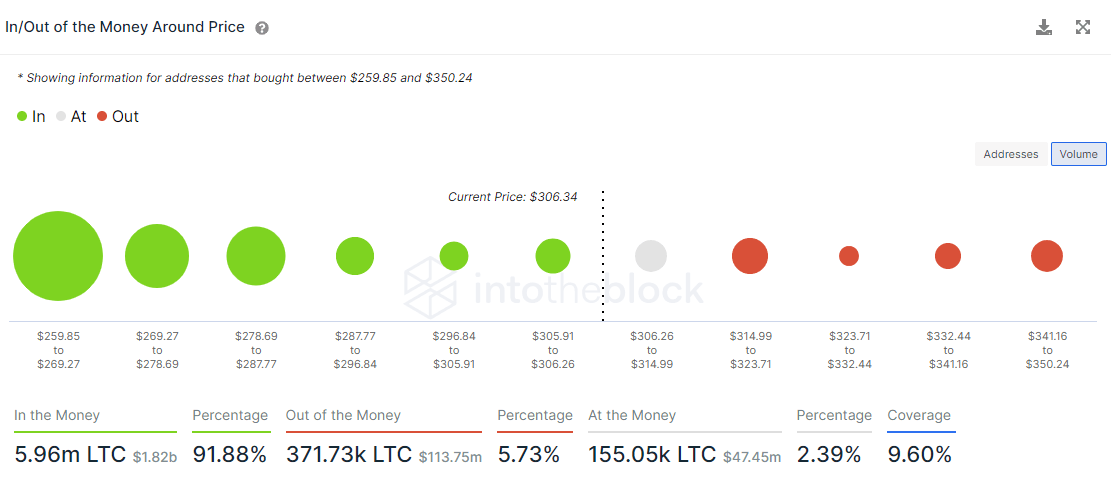
LTC IOMAP data
On the other hand, the whale transaction count has fallen from the peak of 2.501 to 4 as of yesterday. The reading is similar to what preceded the long rally that began in October 2020.
The minimum level of whales (transaction count > 100k USD) points to a new source of buying power moving forward if Litecoin price can get off the mat.
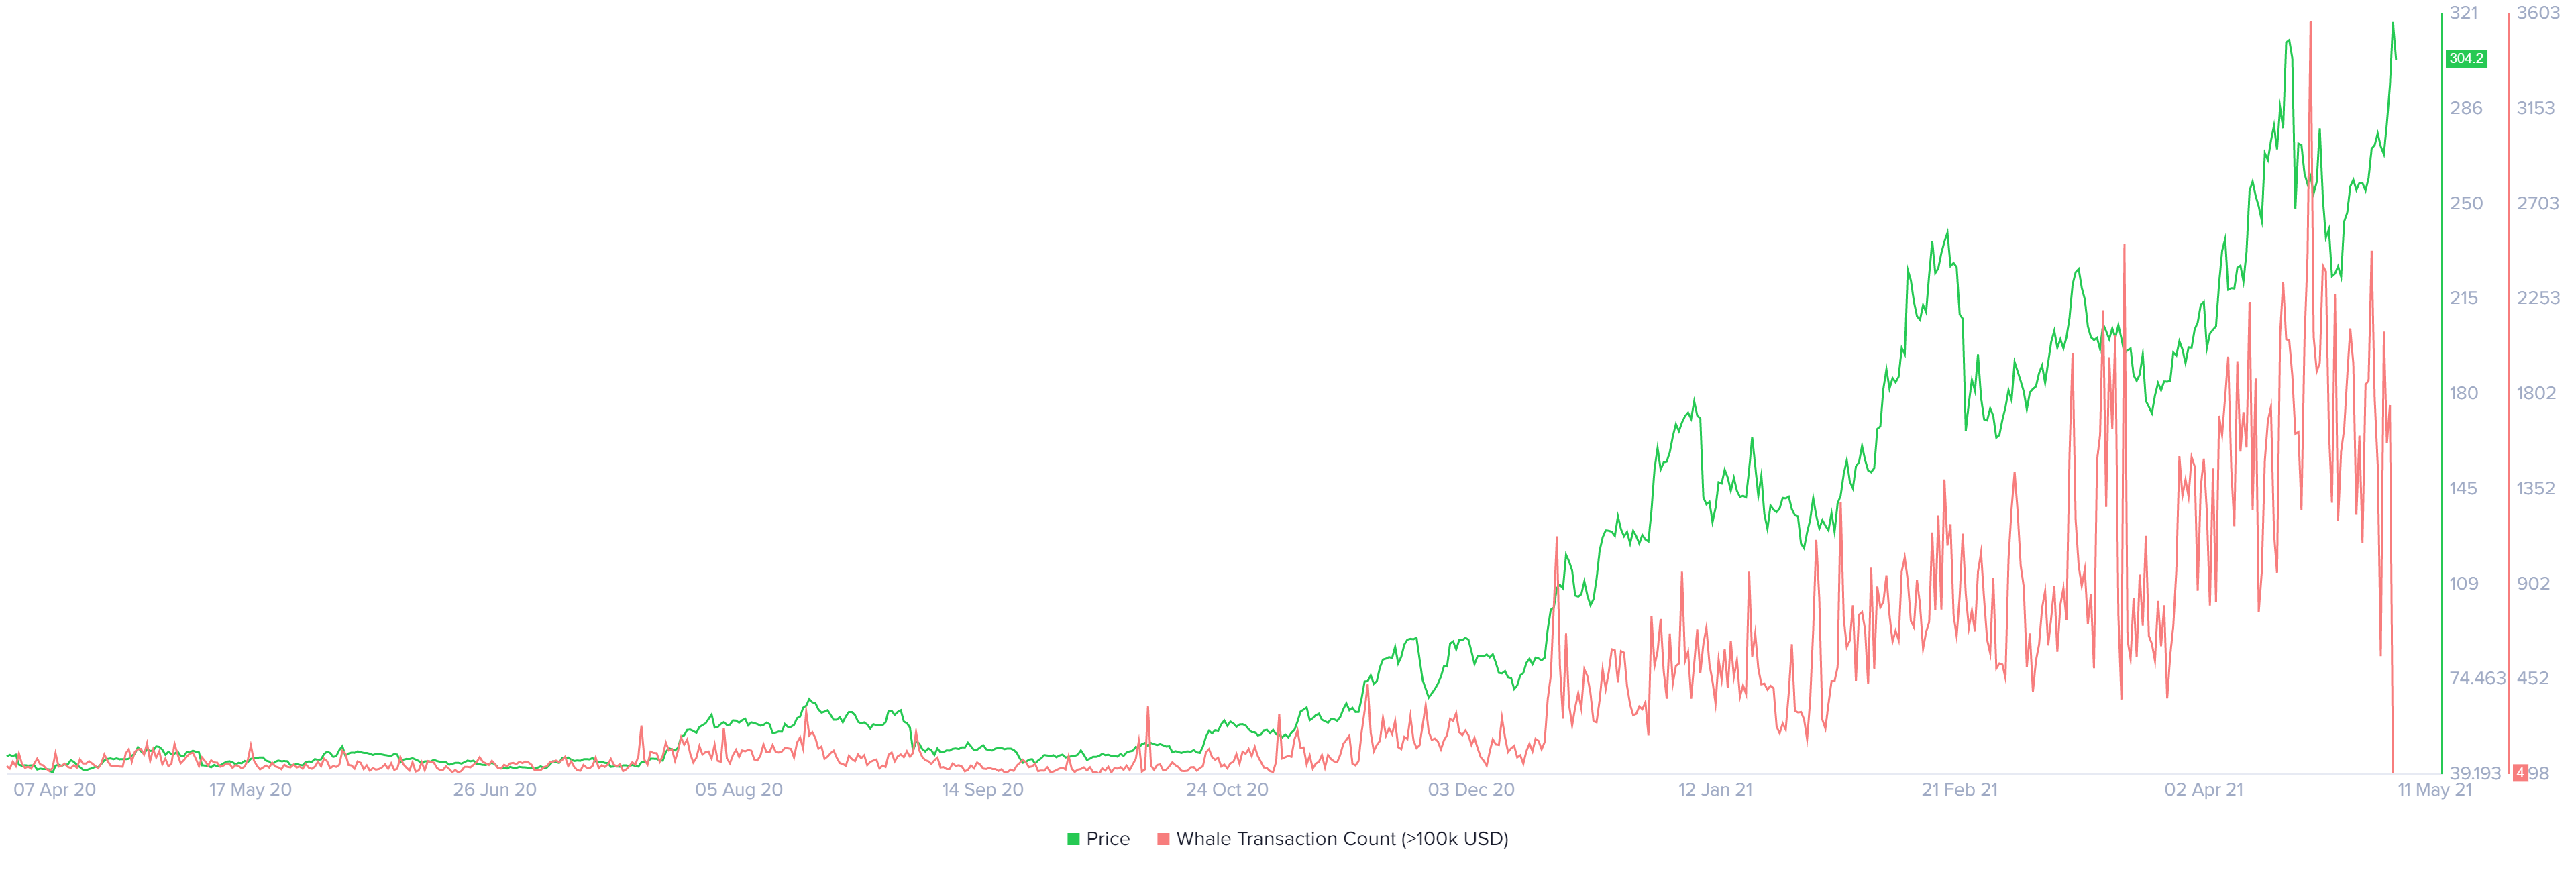
LTC Whale Transaction Count (>100K USD)
The on-chain metrics offer a positive outlook for Litecoin price, but the resilience of the 78.6% retracement at $334.86 is a significant obstacle to overcome before the all-time high at $420.00.
A failure to hold the 61.8% retracement at $268.03 will assure a test of the 10-week SMA at $ 231.47 and potentially project a decline to the channel’s lower trend line at $189.65.
Adding to the bearish outlook is the negative momentum divergence between the weekly RSI and price since the mid-February high. If a new rally high is printed, it needs to be confirmed by the momentum index.
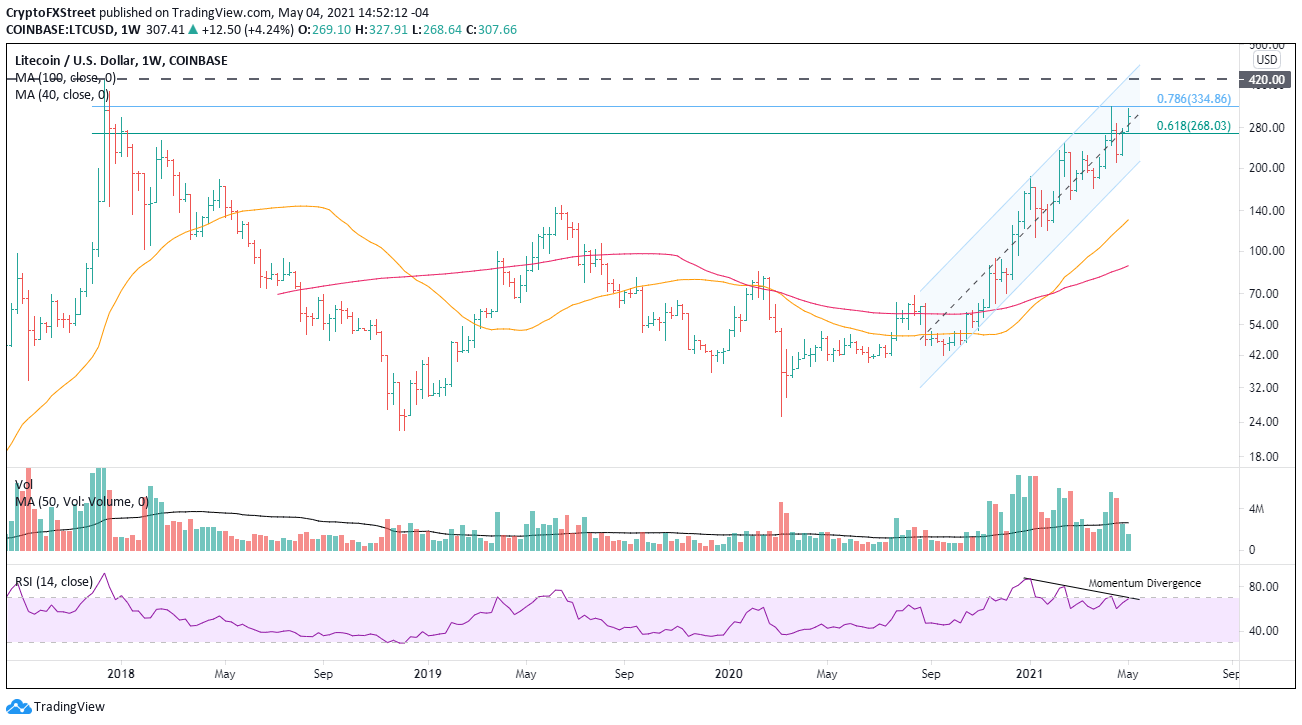
LTC/USD weekly chart
Only a weekly close above 78.6% retracement level will encourage a re-evaluation of the bearish outlook and boost the probability of a successful breakout into new highs in the coming days or weeks.
