Home Litecoin Technical Analysis: $72.50 back in play as buyers give up near $80
Crypto News

Litecoin Technical Analysis: $72.50 back in play as buyers give up near $80

  • Wednesday’s technical correction finds resistance near $80, where the 20-DMA is sitting.
  • The RSI on the daily chart edges lower toward 30.
  • With a break below $72.50, LTC/USD will renew its lowest level since November 2017 and could attract more sellers following a profit-taking action.
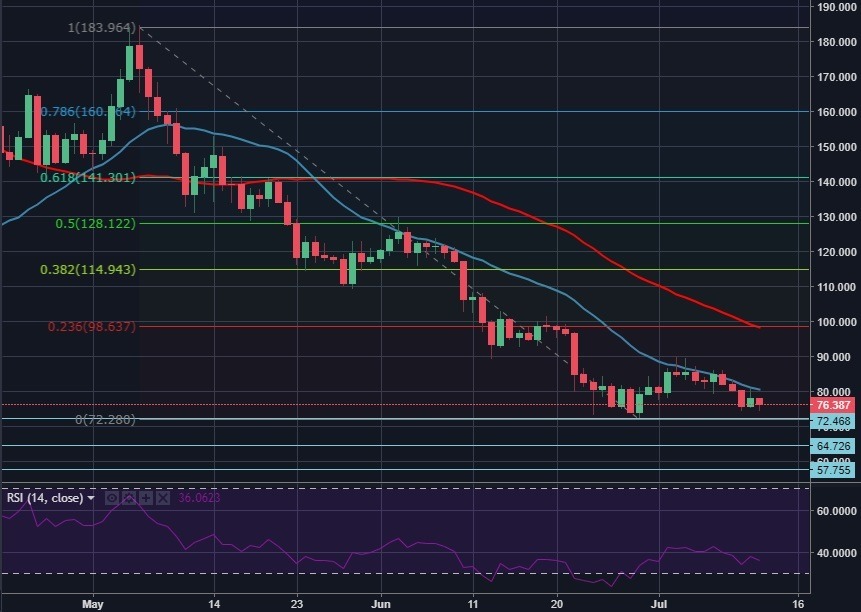
LTC/USD daily chart

Spot rate:                  76.30

Relative change:        -2.4%

High:                         78.25

Low:                          74.28


Trend:                      Bearish


Support 1:                 72.50 (2018 low/ Jun. 29 low).

Support 2:                 64.70 (Nov. 17, 2017, low/static level).    

Support 3:                 57.75  (Nov. 11/10 low/static level).    

Resistance  1:            80 (Jul. 11 high/20-DMA/psychological level).

Resistance 2:            90 (Jul. 3/Jul. 4 high).

Resistance 3:            98 (Fibo. 23.6% retracement of May 6  – Jun. 29 fall)

FX Street

FX Street

FXStreet is the leading independent portal dedicated to the Foreign Exchange (Forex) market. It was launched in 2000 and the portal has always been proud of their unyielding commitment to provide objective and unbiased information, to enable their users to take better and more confident decisions.