Home Litecoin Technical Analysis: LTC/USD comes within a touching distance of 2018 lows, stages modest recovery
Crypto News

Litecoin Technical Analysis: LTC/USD comes within a touching distance of 2018 lows, stages modest recovery

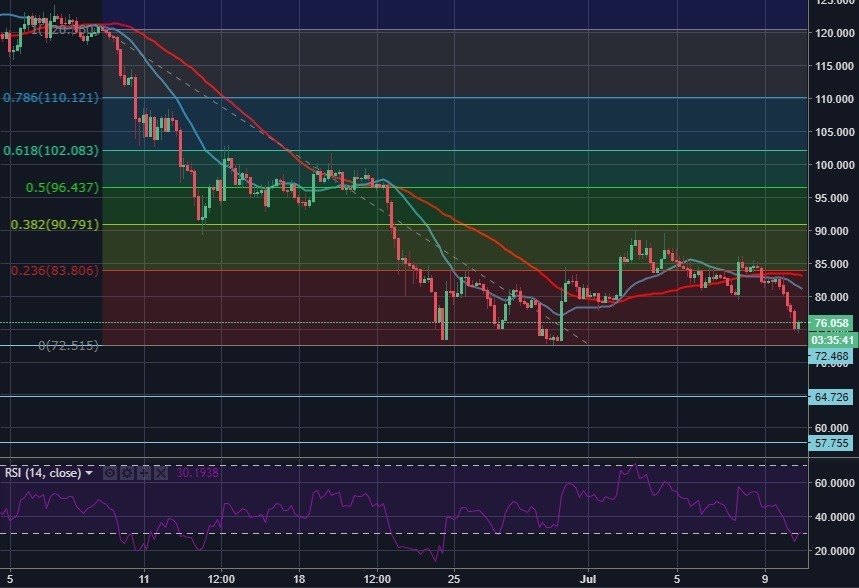
  • LTC/USD touches fresh 10-day low at $74.30, recovers above $76 in the last hour before testing 2018 low at $72.50.
  • RSI indicator on the 4-hour chart suggests that the recovery is a technical correction rather than a fundamentally supported rise.

LTC/USD 4-hour chart

Spot rate:                  76.05

Relative change:        -5.5%

High:                         80.55

Low:                          74.30


Trend:                      Bearish


Support 1:                 72.50 (2018 low/ Jun. 29 low).

Support 2:                 64.70 (Nov. 17, 2017, low/horizontal level)..    

Support 3:                 57.75  (Nov. 11/10 low/horizontal level).    

Resistance  1:            82 (20-DMA).

Resistance 2:            90 (Fibo. 38.2% retracement of Jun. 9 – 29 fall).

Resistance 3:            100/103 (psychological level/Fibo. 61.8% retracement of Jun. 9 – 29 fall)
FX Street

FX Street

FXStreet is the leading independent portal dedicated to the Foreign Exchange (Forex) market. It was launched in 2000 and the portal has always been proud of their unyielding commitment to provide objective and unbiased information, to enable their users to take better and more confident decisions.