Home Litecoin Technical Analysis: LTC/USD drops producing bearish rejection candle in a touted sell zone, bears enjoy the selling below $100 mark
Crypto News

Litecoin Technical Analysis: LTC/USD drops producing bearish rejection candle in a touted sell zone, bears enjoy the selling below $100 mark

  • Litecoin loses ground into the session on Tuesday, dropping 0.5% from the session highs.
  • LTC/USD encountered pressure from the bears in a known sell zone, as they continue to sell rallies.


LTC/USD 60-minute chart
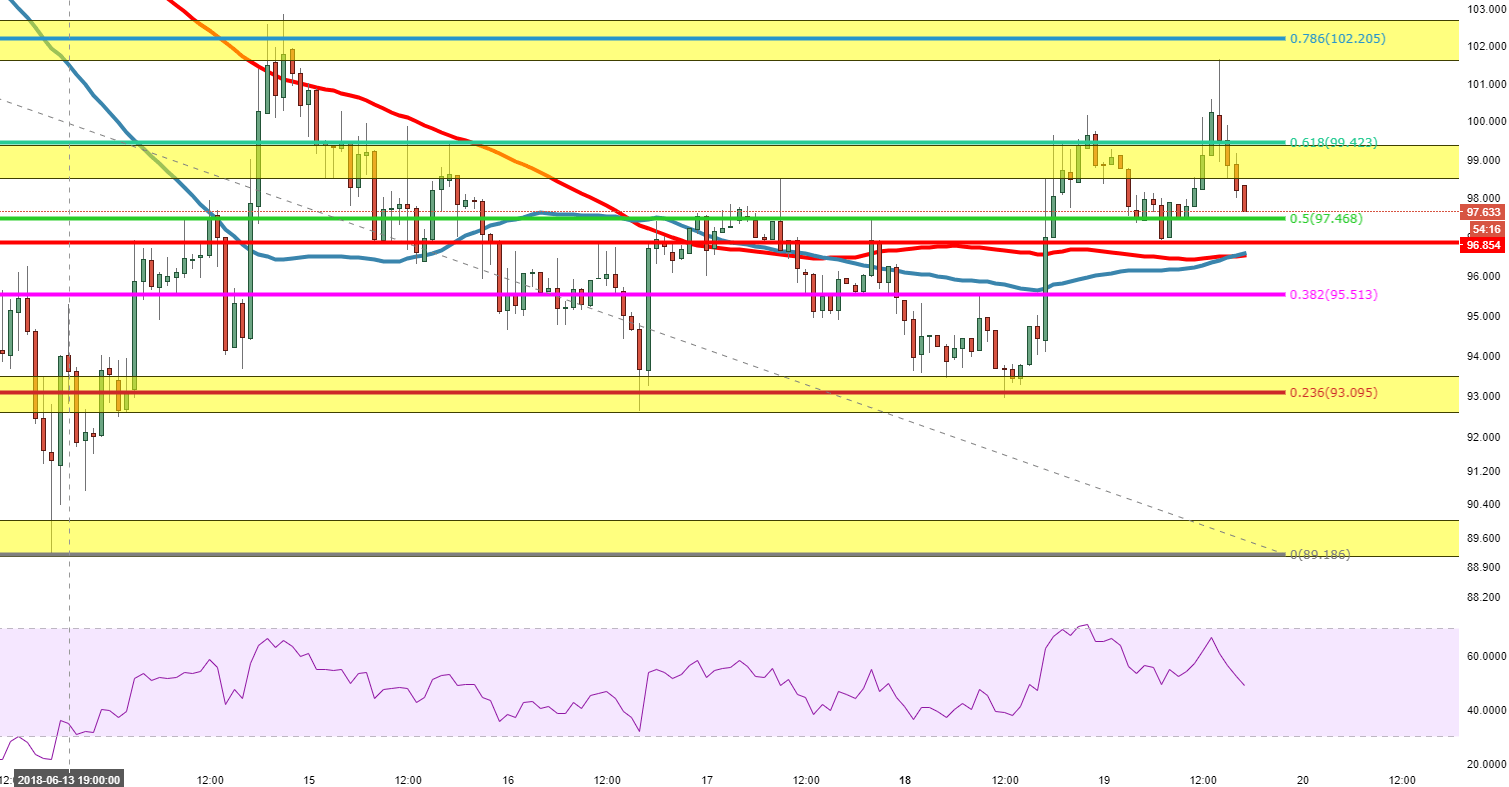
Spot rate:                                     98.305

Relative change:               -0.55%

High:                                                     101.64

Low:                                                       96.89


Trend:                                                   Bearish


Support 1:                                  97.45, 50% Fibonacci.

Support 2:                                    96.892, today’s (Tuesday) lows.

Support 3:                                    96.550, 50 &100MA.

Resistance 1:                           99.408, 61.8%.

Resistance 2:                           101.623, previous demand zone.

Resistance 3:                           102.842, 14th June high.


FX Street

FX Street

FXStreet is the leading independent portal dedicated to the Foreign Exchange (Forex) market. It was launched in 2000 and the portal has always been proud of their unyielding commitment to provide objective and unbiased information, to enable their users to take better and more confident decisions.