- Litecoin price comes under heavy selling pressure, dropping almost 12%, in-line with the crypto session sell-off.
- LTC/USD at lowest levels seen since 7th December 2017, prior to the big bull-run at the end of the year.
LTC/USD daily chart
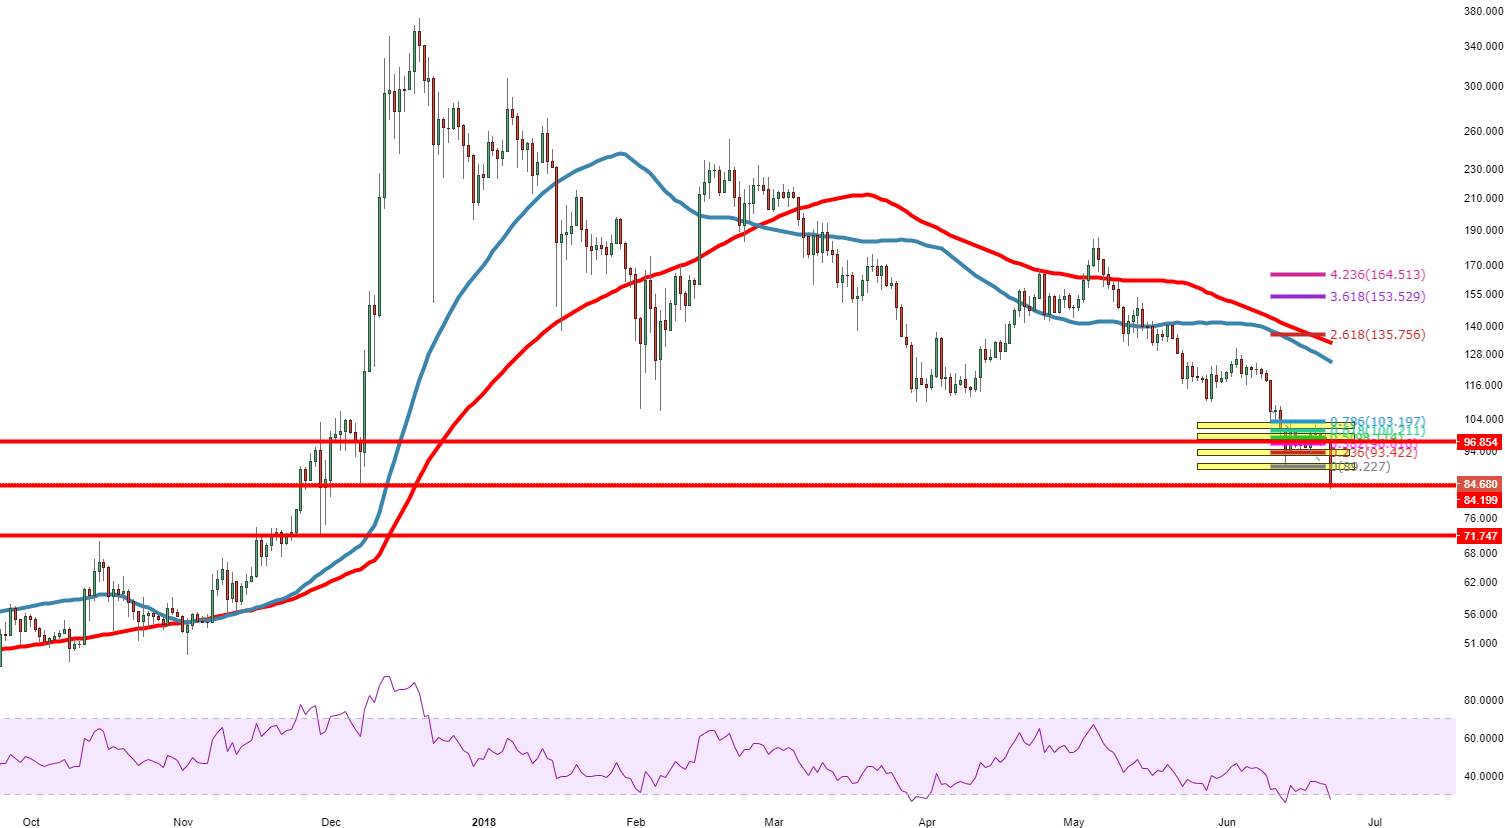
Spot rate: 6633.10
Relative change: -12.12%
High: 96.885
Low: 83.040
Trend: Bearish
Support 1: 84.200, ascending trend line.
Support 2: 81.113, (support on daily time frame).
Support 3: 71.747, 29th November low.
Resistance 1: 89.000, previous demand zone.
Resistance 2: 92.444, (resistance on daily chart).
Resistance 3: 92.94, 18th June low.
