- Litecoin price trading down around 2% in the early part of Tuesday’s session, price struggles to hold gains seen at the daily open.
- LTC/USD via the 60-minute chart view has formed a head and shoulders pattern, subject to a potential breakout south.
- Neckline of above-mentioned pattern seen at around $28.70, a breach could open the door for another chunky drop.
LTC/USD 60-minute chart
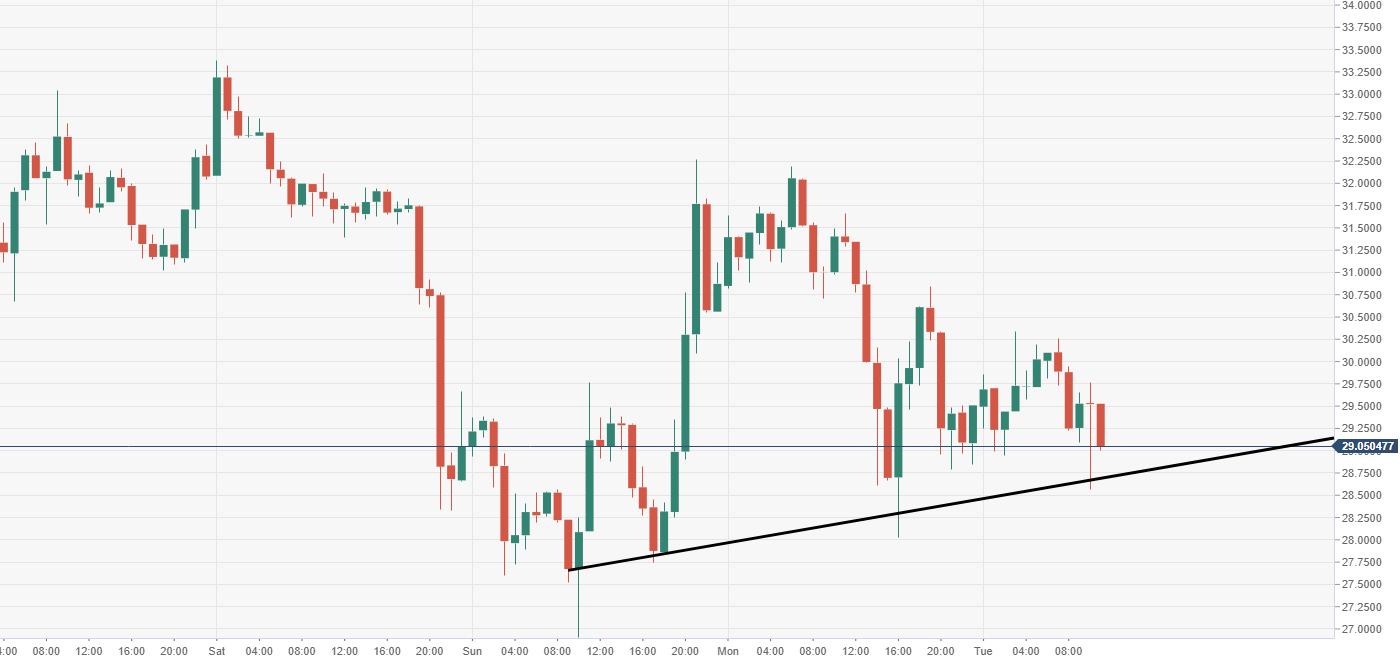
Spot rate: 29.01
Relative change: -2.20%
High: 30.34
Low: 28.58
Trend: Bearish
Support 1: 28.70, neckline of h & s pattern.
Support 2: 27.62, daily pivot point support.
Support 3: 25.74, daily pivot point support.
Resistance 1: 31.78, daily pivot point resistance.
Resistance 2: 34.06, neckline of double bottom.
Resistance 3: 35.94, daily pivot point resistance.
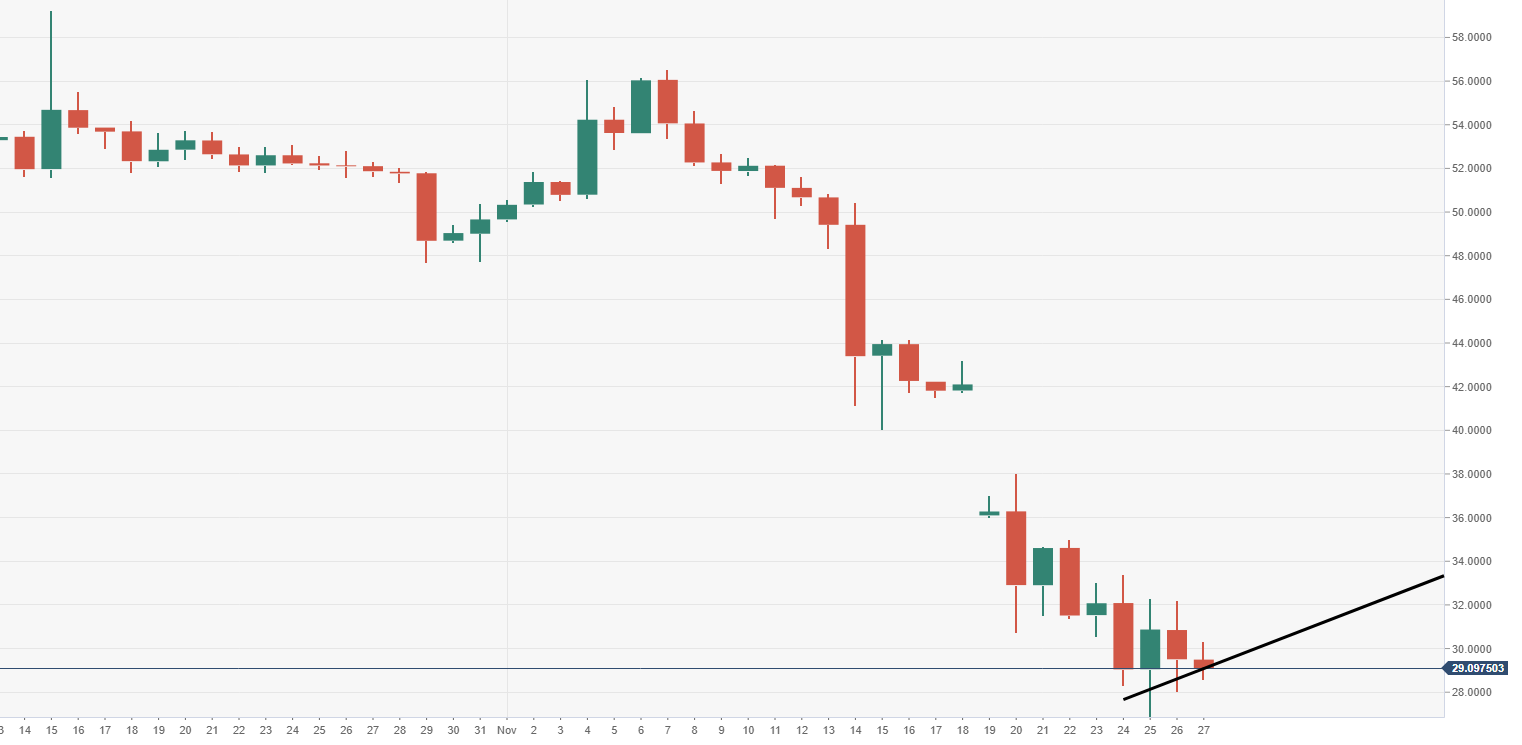
LTC/USD daily chart
- The bearish trend remains firm, as any daily session seen in the green, is the day after sold. Bulls are incapable of sustaining any upside momentum for now.