LTC/USD daily chart
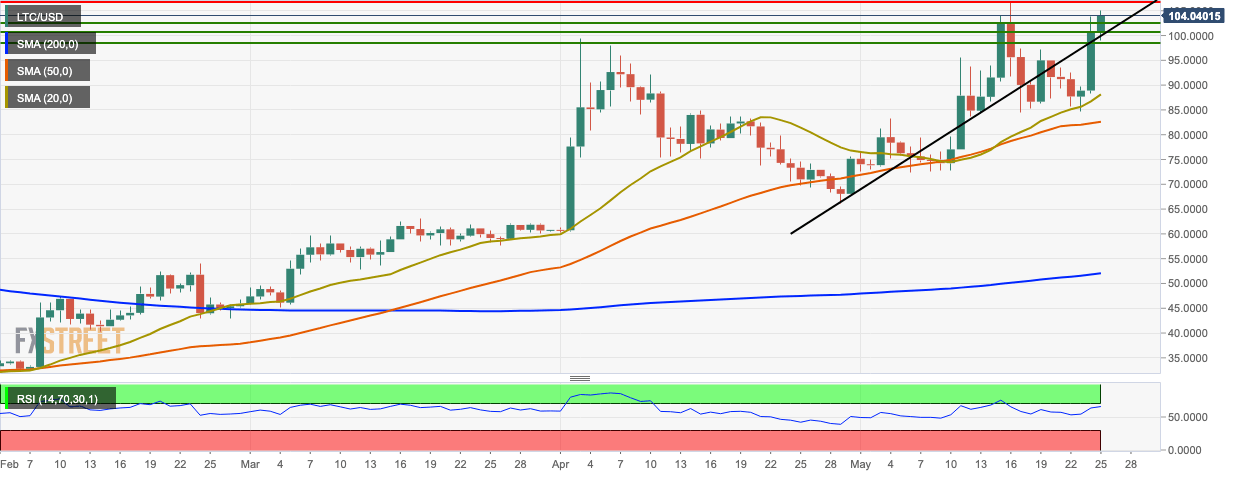
- LTC/USD went up from $100.50 to $104 this Saturday.
- The bulls need to overcome the resistance level at $107.
- The market is trending above the 200-day simple moving average (SMA 200), SMA 50 and SMA 20 curves.
- The latest session finds support at the upward trending line.
- The relative strength index (RSI) indicator is trending at 66.67 next to the overbought zone.
LTC/USD 4-hour chart
-636943583716820526.png)
- The latest session is trending above the upper curve of the 20-day Bollinger band, which shows that it may be over-valued and faces correction.
- The 4-hour market was trending in a flag formation from which it had a bullish breakout.
- The widening of the 20-day Bollinger band indicates higher market volatility.
- The moving average convergence/divergence (MACD) indicator shows increased bullish momentum.
- The SMA 20 curve has crossed over the SMA 50 curve which is a bullish sign.
LTC/USD hourly chart
-636943583349782204.png)
- The hourly LTC/USD price had a bullish breakout from the green cloud of the Ichimoku indicator.
- The price is currently trending upwards in a channel formation.
- The Ichimoku indicator shows that the upcoming future market sentiment is bearish.
- The Elliot oscillator has had two straight bullish sessions following six consecutive bearish sessions.
Key levels
