- Litecoin price trading with modest gains of around 1% on Thursday, in the second half of the session.
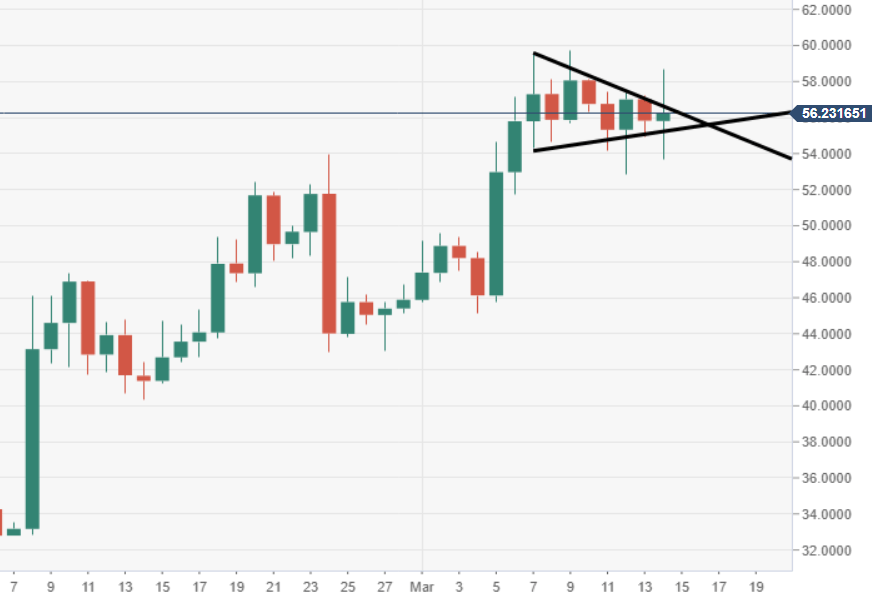
- LTC/USD daily price action has formed a bullish pennant pattern, subject to a potential breakout higher.
Spot rate: 56.29
Relative change: +0.95%
High: 58.68
Low: 53.71
Trends:
Daily SMA20: 51.1513
Daily SMA50: 43.2659
Daily SMA100: 36.8509
Daily SMA200: 44.5307
Levels:
Previous Daily High: 57.2004
Previous Daily Low: 54.9044
Previous Weekly High: 59.5887
Previous Weekly Low: 45.1089
Previous Monthly High: 53.9838
Previous Monthly Low: 30.8359
Daily Fibonacci 38.2%: 55.7815
Daily Fibonacci 61.8%: 56.3233
Daily Pivot Point S1: 54.7539
Daily Pivot Point S2: 53.6811
Daily Pivot Point S3: 52.4579
Daily Pivot Point R1: 57.0499
Daily Pivot Point R2: 58.2732
Daily Pivot Point R3: 59.346
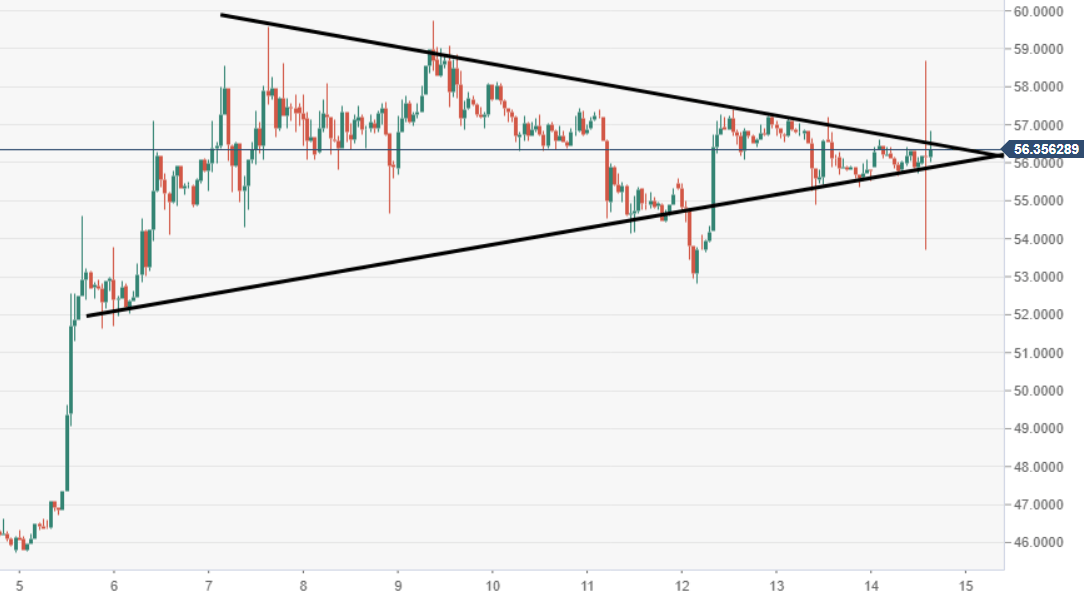
LTC/USD 60-minute chart
- Over the 60-minute chart view the price is moving within a large triangular pattern structure.
LTC/USD daily chart
- Price action is still moving within the confinements of a bullish pennant pattern.
- The formation of the above-noted has been observed since 7th March, subject to a breakout.