LTC/USD daily chart
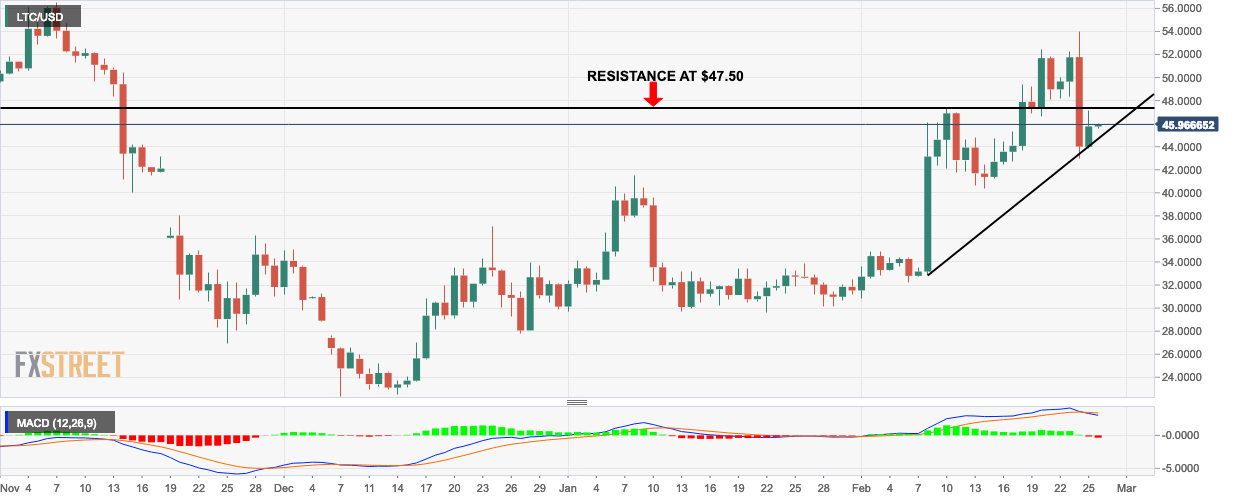
- LTC/USD went up from $44.23 to $45.75 this Tuesday.
- The last session was bullish as LTC/USD found support on the upward trending line.
- The moving average convergence/divergence(MACD) shows bearish momentum.
LTC/USD 4-hour chart
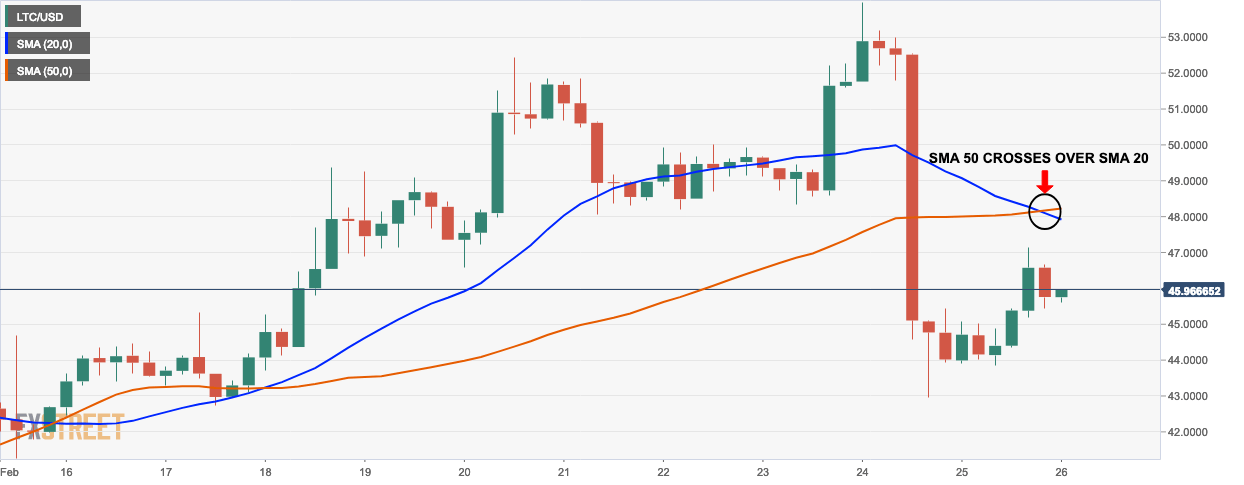
- The LTC/USD 4-hour chart shows that the 50-day simple moving average (SMA 50) curve has crossed over the SMA 20 curve which indicates a sell signal.
LTC/USD hourly chart
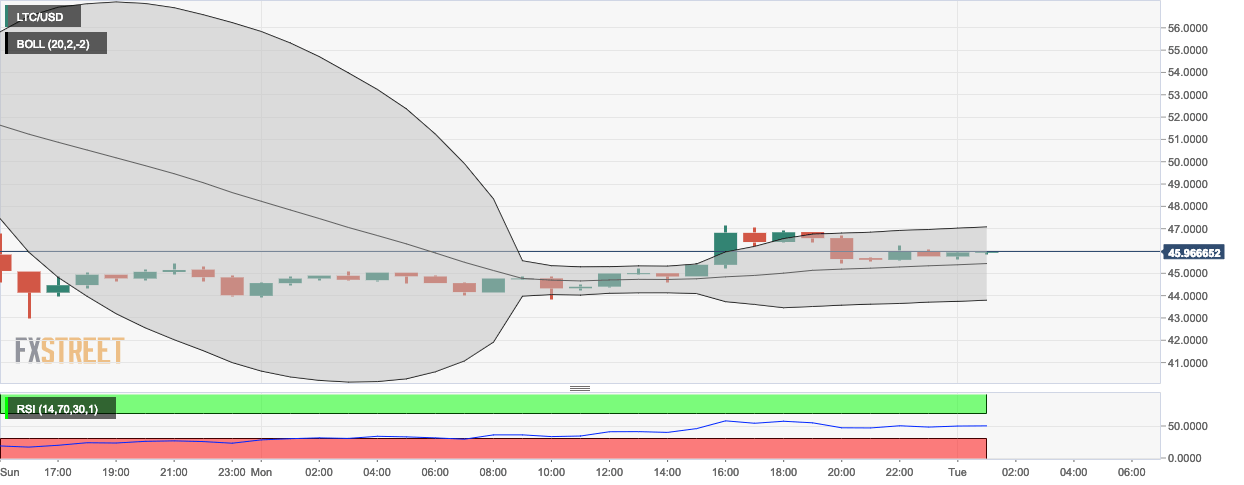
- The 20-day Bollinger band curve shows that the hourly LTC/USD market is still trending over the SMA 20 curve.is trending in the neutral zone.
- The bears and bulls are canceling each other out as the relative strength index (RSI) curve
Key Levels
- Resistance 3: $50.6432
- Resistance 2: $48.8978
- Resistance 1: $47.3288
- Pivot Point: $45.5833
- Support 1: $44.0143
- Support 2: $42.2688
- Support 3: $40.6998
