- The trendline on the 1-hour chart shows now sign of slowing down.
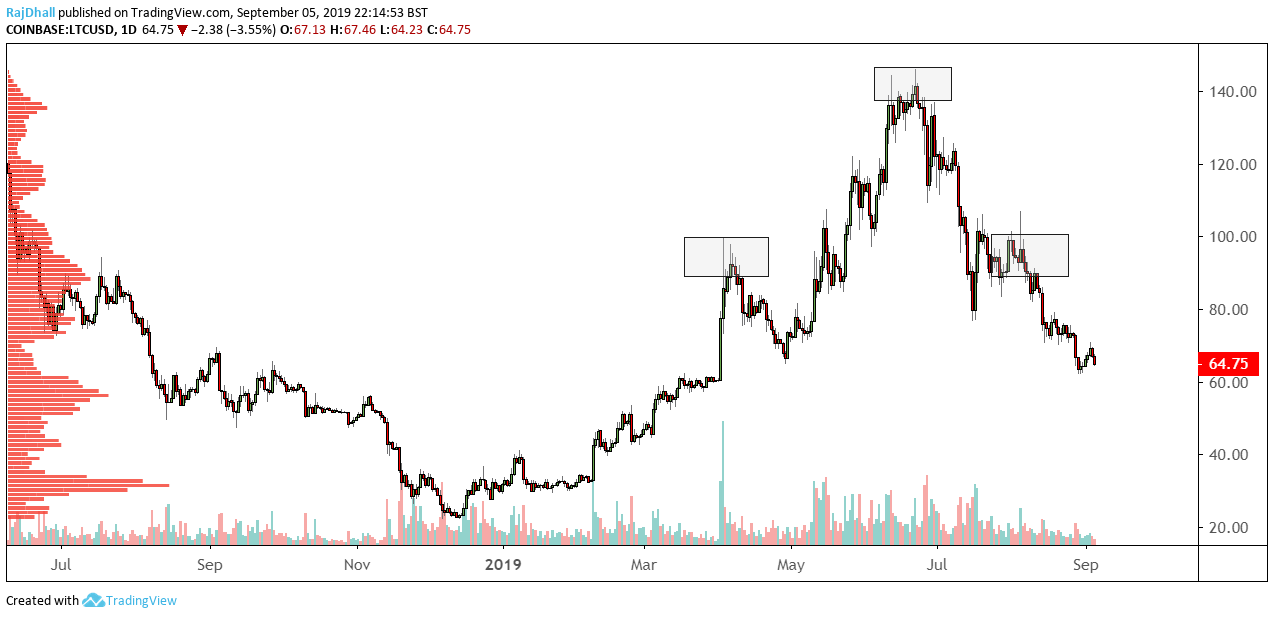
- The daily chart has a textbook head and shoulders formation which leads to targets lower down.
- Today Litecoin is one of the underperformers trading lower by 2.36%.
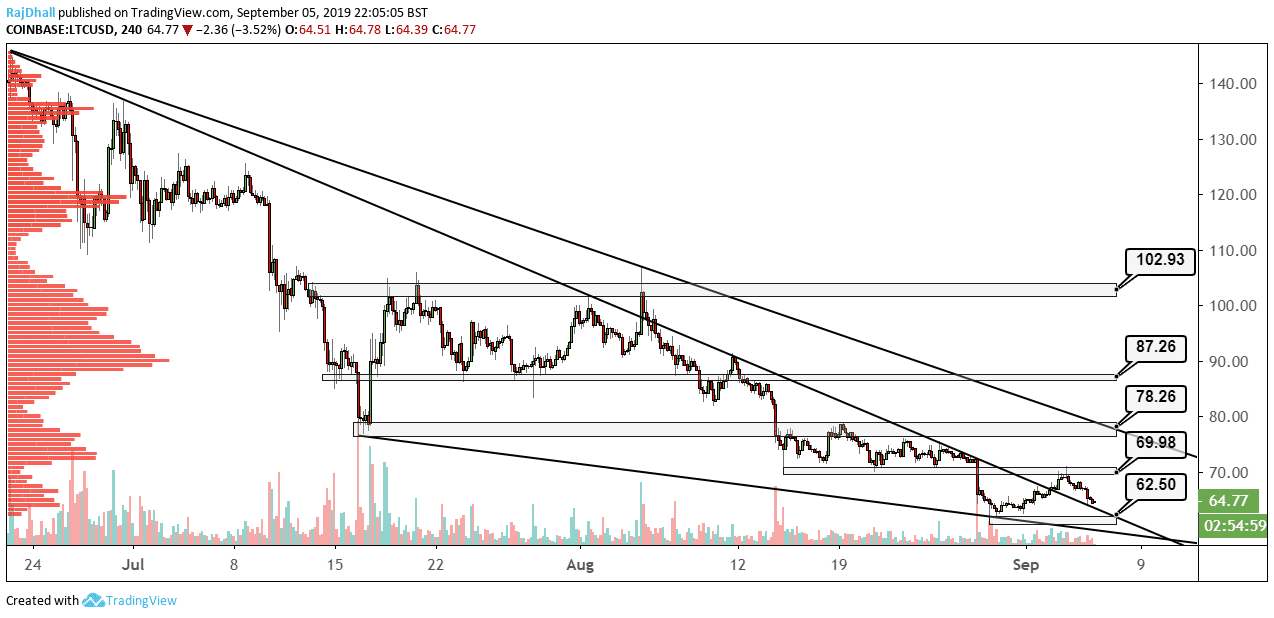
Litecoin has been in a serious downtrend for a while now. On the 1-hour chart above, on the technical front, we can see the trend has made a consecutive set of lowe highs and lower lows since 24th July.
Now there is a low that looks like it could open up to the abyss. 62.50 is the previous wave low on the chart and after the 70 level was rejected it seems traders are trying to push the price lower.
Volume has started wearing thin which could mean LTC/USD is forming a base so a break of 70.00 could confirm this.
On the daily chart below it shows that the shorter-term chart above is confirming the “short scenario”.
The chart below shows a textbook head and shoulders formation and according to traditional targets we could be heading to 60.00.