- XMR/USD went up from $82.40 to $83.60 in the early hours of Friday.
- Technical indicators show decreasing market volatility.
XMR/USD is currently trending in an upwards channel formation, as the bulls are set to dominate for the third day in a row. The bulls have been in full control after XMR/USD charted the morning star pattern. The hourly price breakdown shows that XMR/USD fell to $80.75 before the bulls took control and took the price up to $82.40. The bears attempted to check the price down to $82.06 before the bulls took it back up to $83.60.
XMR/USD daily chart
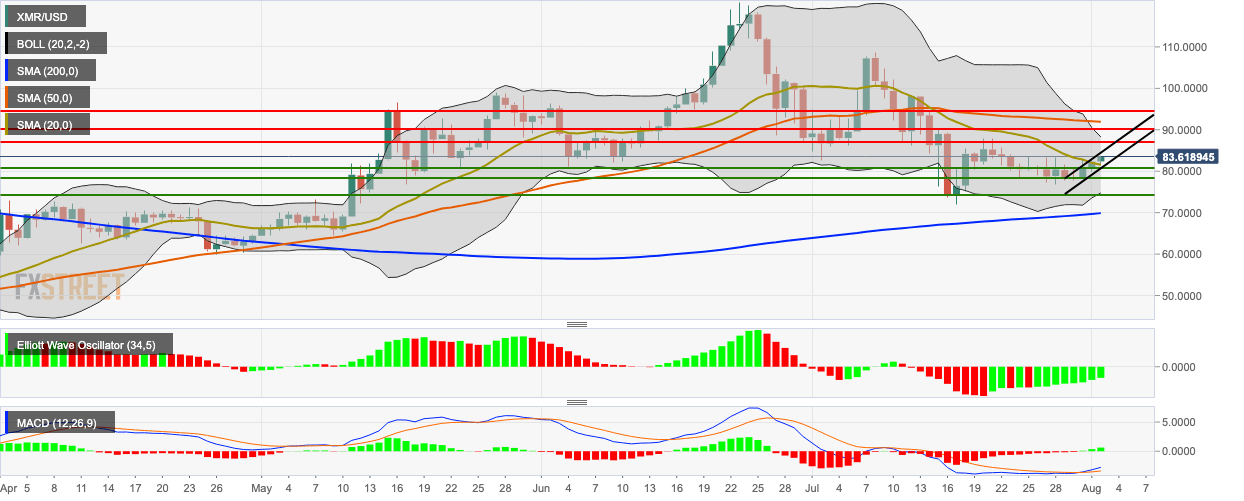
The latest price action took the bulls past the resistance offered by the 20-day simple moving average (SMA 20) curve. The price chart is trending below the SMA 50 curve and above the SMA 200 curve. The narrowing of the 20-day Bollinger jaw indicates decreasing market volatility. The Elliot oscillator has had eight straight bullish sessions, while the moving average convergence/divergence (MACD) indicates sustained bullish momentum.
