- XMR/USD has found resistance on the SMA 50 curve and dropped down.
- Elliott Oscillator has had a bearish session following six straight bullish sessions.
Monero has had a heavily bearish start to the day as the sellers managed to take the price down from $81.35 to $73.45. The price charted a bearish engulfing pattern and has found resistance on the 50-day Simple Moving Average (SMA 50) curve. The hourly breakdown shows us that the price dropped from $81.35 to $73.45 within five hours.
XMR/USD daily chart
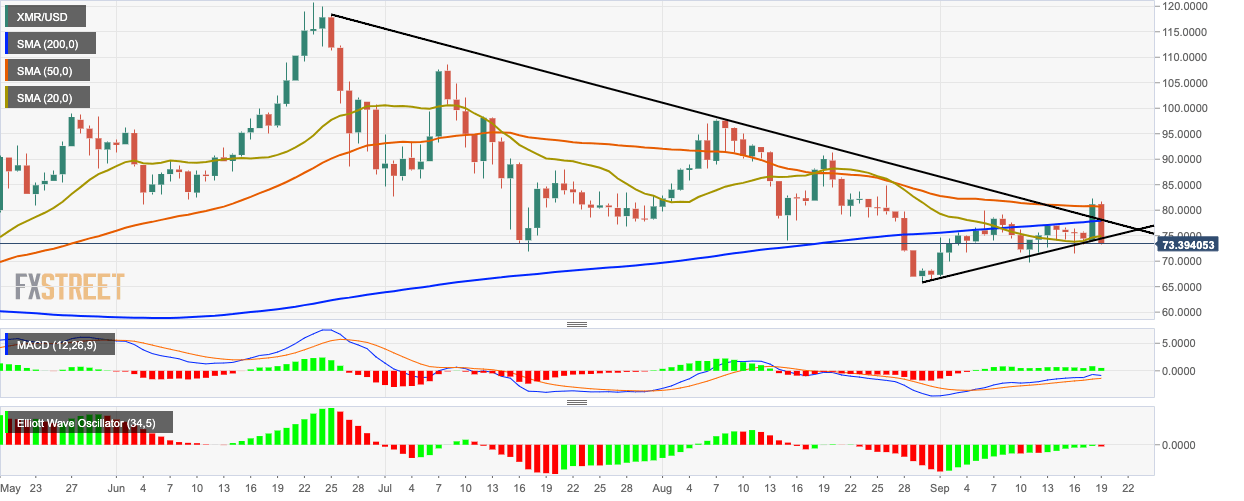
After finding resistance at the SMA 50 curve, the market has dipped below the SMA 200 as well. Currently, the market has found support at the SMA 20 curve. The Moving Average Convergence/Divergence (MACD) indicator shows decreasing bullish momentum. The Elliott Oscillator has had a bearish session following six straight bullish sessions.
