- The Elliott Oscillator has had six straight green sessions.
- The 20-day Bollinger Band has constricted, indicating decreasing market volatility.
XMR/USD daily chart
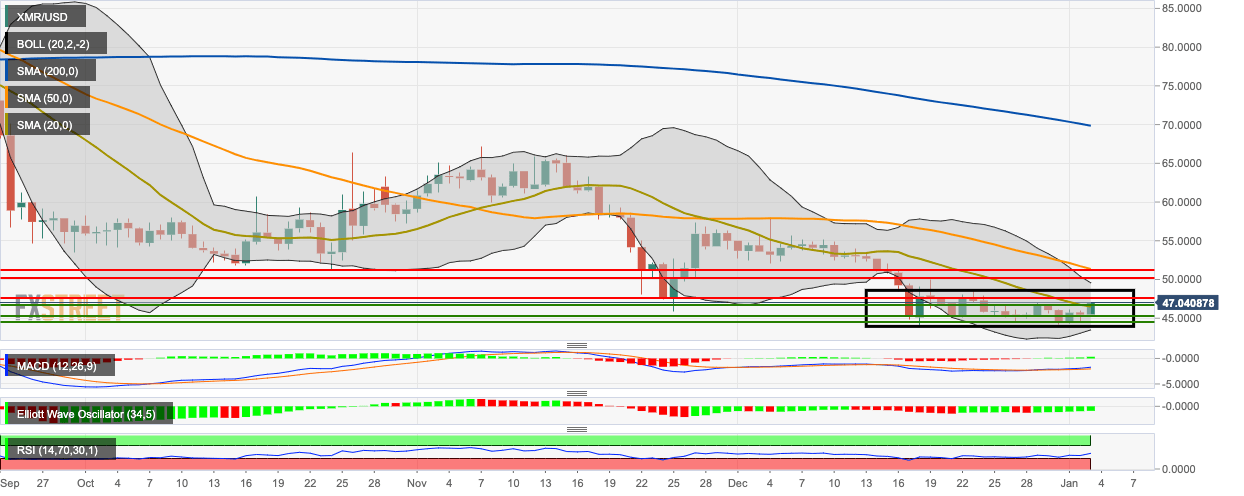
XMR/USD went up from $45.50 to $47, charting a 3.30% increase in the early hours of Friday. Currently, the bulls are negotiating with the resistance at the 20-day Simple Moving Average (SMA 20) curve. The 20-day Bollinger Band has narrowed considerably, indicating decreasing price volatility. The Elliott Oscillator has had six straight green sessions, meaning that the market sentiment is currently bullish. The Moving Average Convergence/Divergence (MACD) indicates increasing bullish momentum.
