- XMR/USD is floating above the SMA 20 and SMA 50 curves.
- The RSI indicator is trending around 62.15.
XMR/USD is trending in an upwards channel formation, despite having a bearish start to the day. So far this Thursday, XMR/USD has gone down from $65.50 to $65. This follows a heavily bullish Wednesday wherein Monero went up from $62.25 to $65.25. The hourly breakdown of Wednesday and Thursday shows us that XMR/USD bulls managed to bounce off intraday support at $62. The price gathered enough momentum to go up to $65.50, before settling around $65.
XMR/USD daily chart
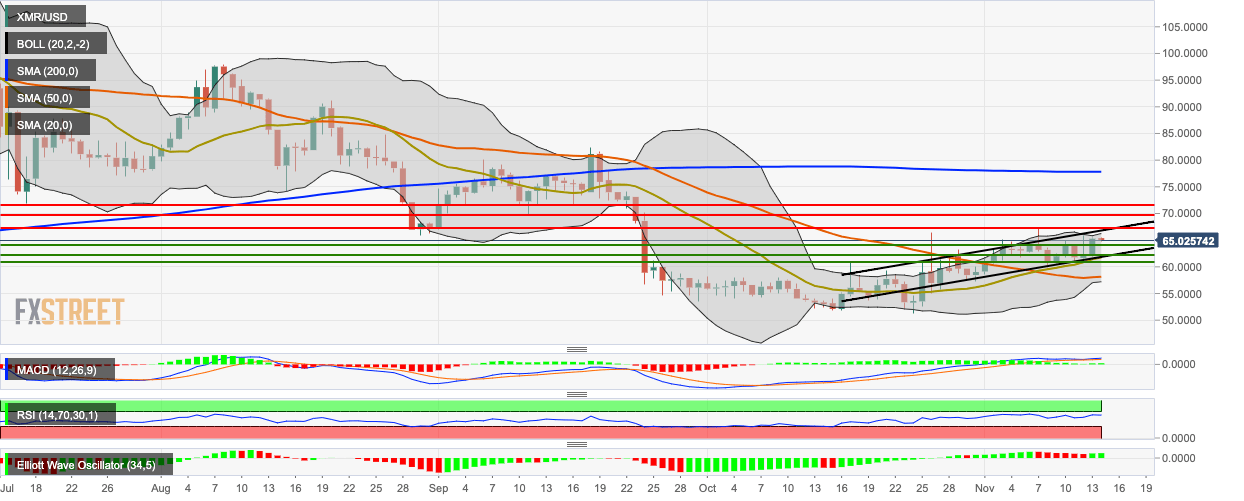
The daily price is floating around the 20-day Simple Moving Average (SMA 20) and SMA 50 curves. The Moving Average Convergence/Divergence (MACD) indicates decreasing bullish momentum, while the Elliott Oscillator has had two green sessions following six straight red sessions. The Relative Strength Index (RSI) indicator is trending around 62.15.
