- The Lucid SAR in the daily chart has flipped from bullish to bearish.
- The 3-day chart is about to slash a sell signal in the TD sequential indicator with a red-nine candlestick.
Monero found support at the 100-day SMA and climbed up from $76.85 on September 3 to $133.50 on October 27. Since then, the privacy coin fell to $122.55. During this drop, the Lucid SAR has turned from bullish to bearish. As such, we expect the price to fall towards the 50-day SMA ($110). A further drop could take us to the 100-day SMA ($99), falling below the $100-mark in the process.
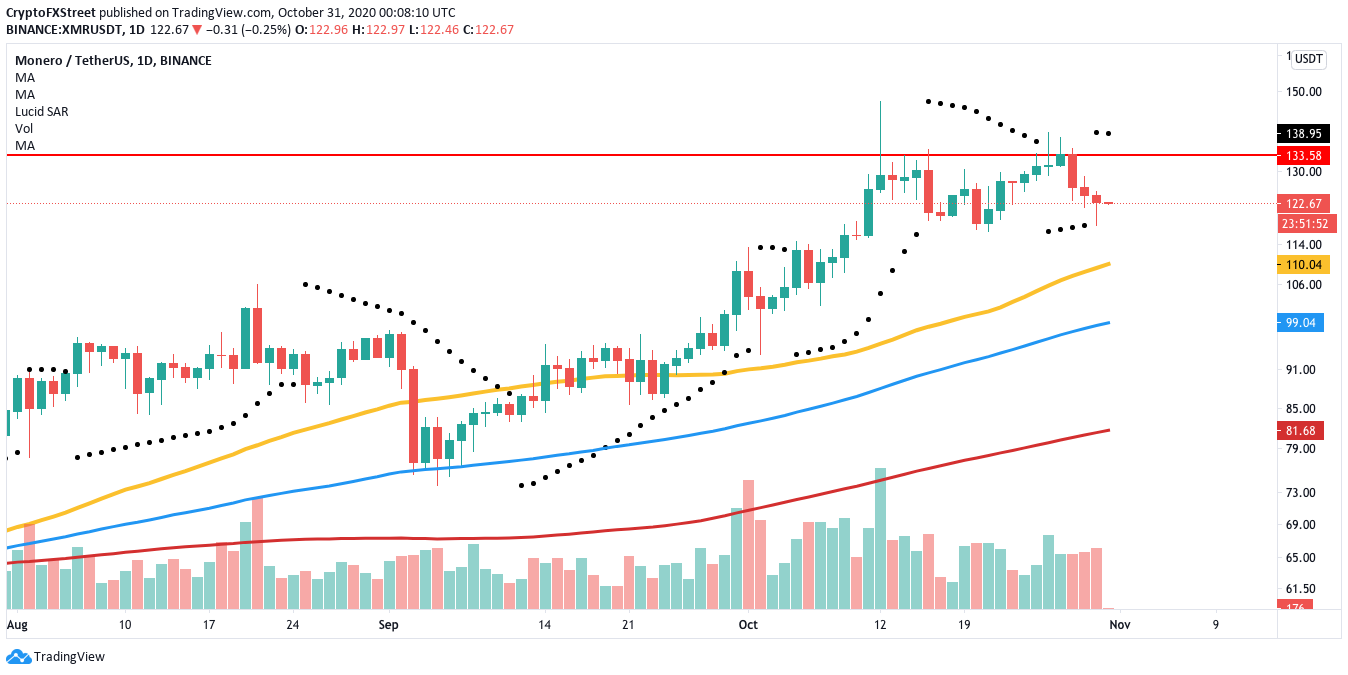
XMR/USDT daily chart
The 3-day chart for XMR adds further credence to our bearish outlook. It looks like the price is on the verge of flashing a sell signal in the TD sequential indicator with a red-nine candlestick. As per price history, the nearest support lies at $113.25. A break below that could take the 3-day price to $95.
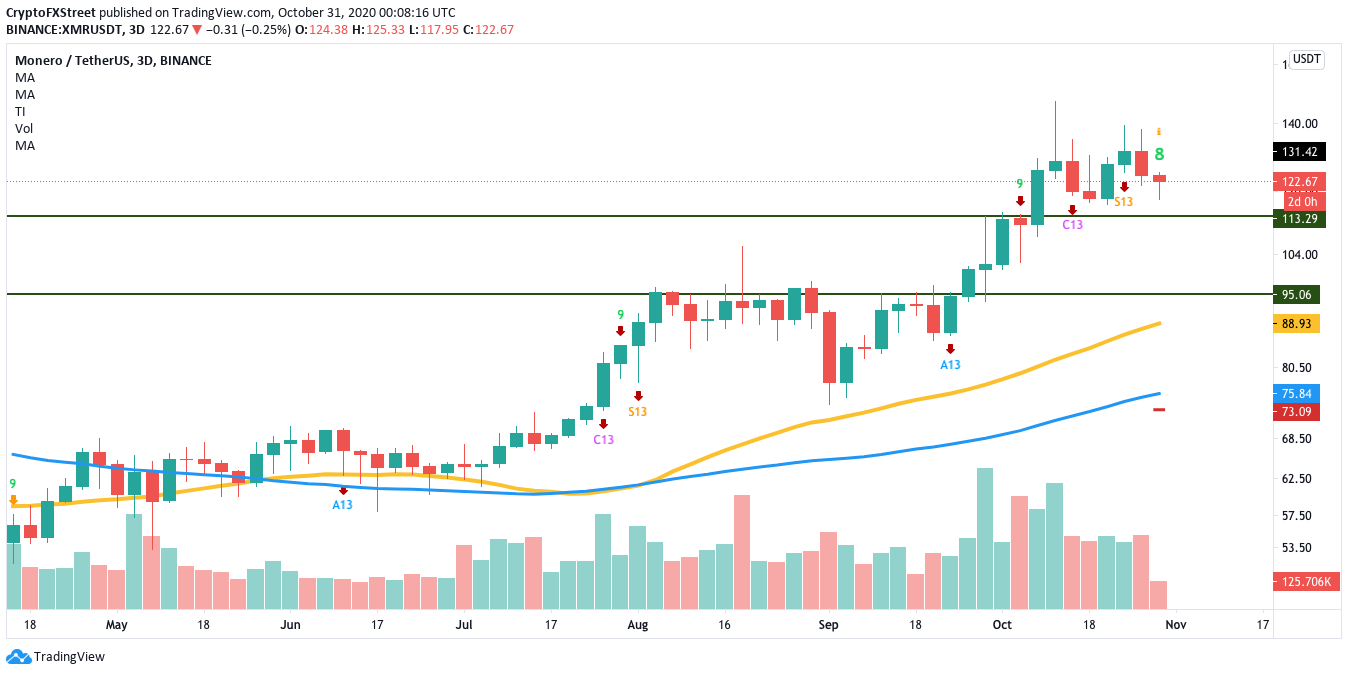
XMR/USDT 3-day chart
The Flipside: How can the bulls take control?
If the XMR buyers somehow take back control, they will need to break past the $133.50 resistance barrier. If they do that, then not only should they have enough momentum to flip the Lucid SAR from bearish to bullish, but they should be able to cross the $150-level, as well.
Key price levels to watch
The sellers will aim to retain their control and drop the price to the 100-day SMA ($99).
The bulls can take control by flipping the $133.50 resistance to support and aim for $150.
