- The MACD indicator in the daily chart shows a reversal of bearish momentum.
- XMR/USD dropped below the 20-day Bollinger Band in the four-hour chart, before the bulls pushed it back in.
XMR/USD daily chart
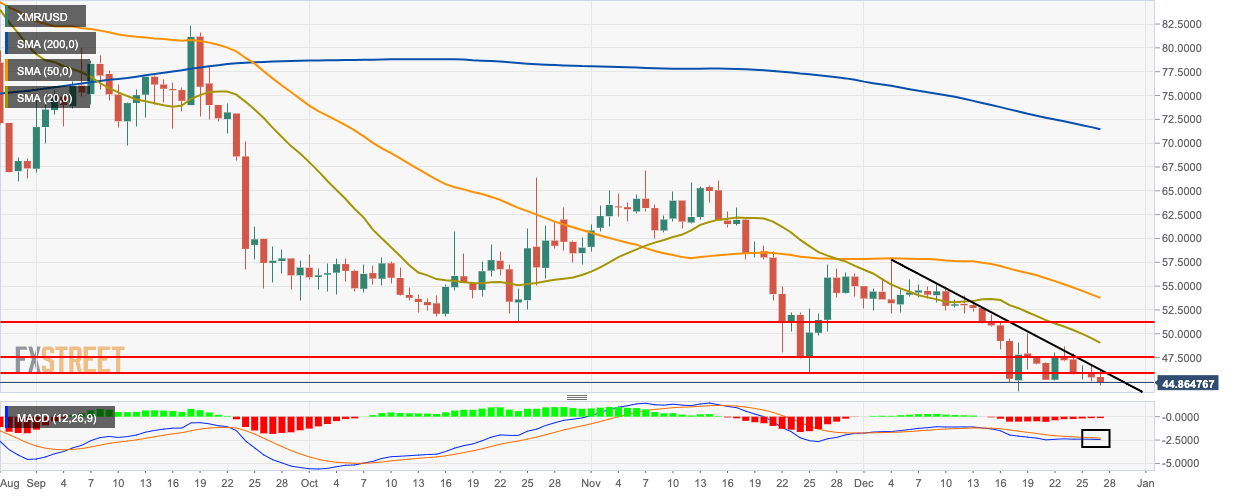
XMR/USD fell from $45.45 to $44.70 so far this Friday, charting a second consecutive bearish day. The price is curtailed below the downward trending line and the 20-day Simple Moving Average (SMA 20) curve. The bulls will need to overcome resistance at the $46 to stop any further downward movement. The Moving Average Convergence/Divergence (MACD) line is looking to cross over with the signal line, which indicates a reversal of the bearish momentum.
XMR/USD four-hour chart
-637130800912889086.png)
XMR/USD dropped below the 20-day Bollinger Band before it bounced up from the $44.69 support line and jumped back inside the Band. The SMA 20 curve acts as a resistance to the price. The Elliott Oscillator has had eight straight red sessions of increasing intensity.
XMR/USD hourly chart
-637130800382097845.png)
XMR/USD is trending in a downward channel pattern in the hourly chart. The Relative Strength Index (RSI) indicator is hovering around 37.50, which shows that we might be in the midst of a length sell-off period before the bulls jump back in.
Key Levels
