- NEO/USD has gone up from $9.13 to $9.19 in the early hours of Tuesday.
- The market is trending below the red Ichimoku cloud.
NEO/USD managed to trend horizontally after charting two straight bullish days. Neo has gone up from $9.13 to $9.19 in the early hours of Tuesday. The market has found resistance at the two downward trending lines. The hourly breakdown of Tuesday shows us that the price fell to $8.93 before boosting up all the way to $9.22. Over there, the price met resistance and fell to $9.19.
NEO/USD daily chart
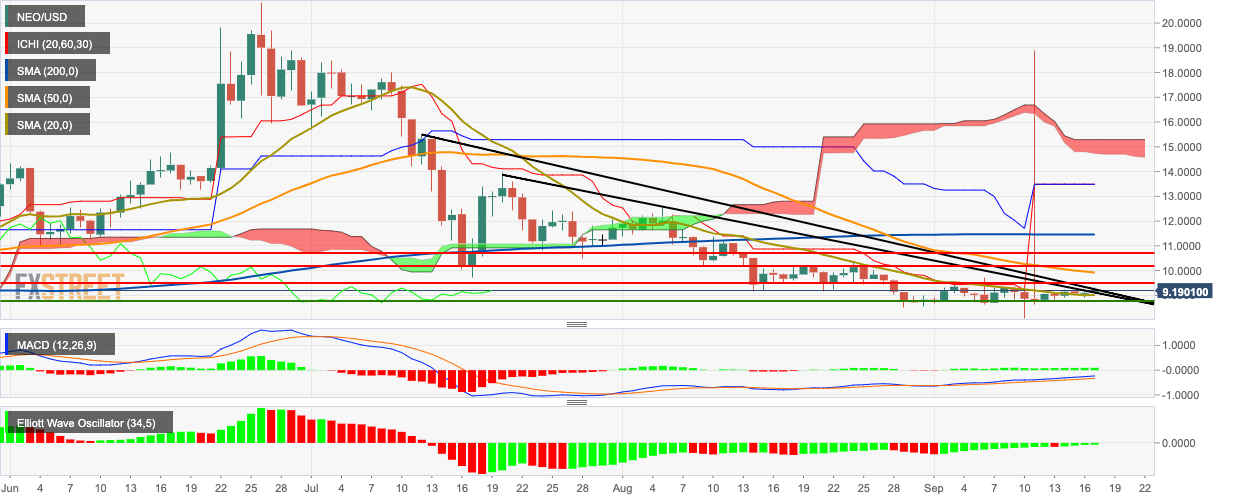
NEO/USD daily chart is trending below the red Ichimoku cloud, 200-day simple moving average (SMA 200) and SMA 50 curves. The market has found support at the SMA 20 curve. The moving average convergence/divergence (MACD) indicator shows sustained bullish momentum. The Elliott oscillator shows four straight bullish sessions.
