- NEO/USD in on the course of having a hattrick of bullish days.
- The market momentum has shifted from bearish to bullish as per the MACD indicator.
NEO/USD daily chart
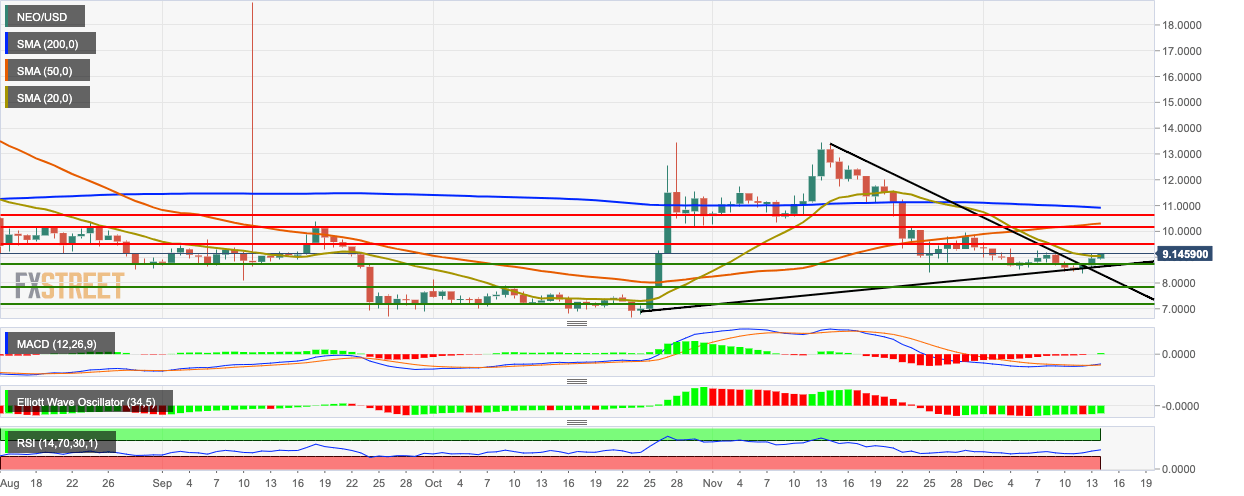
NEO/USD went up from $8.95 to $9.15 in the early hours of Saturday and is on the course of charting a hattrick of bullish days. During this time, NEO/USD went up from $8.56 to $9.15, breaking above the triangle pattern. The market is still floating below the 200-day Simple Moving Average (SMA 200), SMA 50 and SMA 20 curves. The market momentum has shifted from bearish to bullish as per the Moving Average Convergence/Divergence (MACD) indicator. The Elliott Oscillator has had seven green sessions out of the last eight, while the Relative Strength Index (RSI) indicator is trending around 51.25.
