- NEO/USD floats above the green Ichimoku cloud.
- The MACD indicator shows decreasing bearish momentum.
NEO/USD daily chart
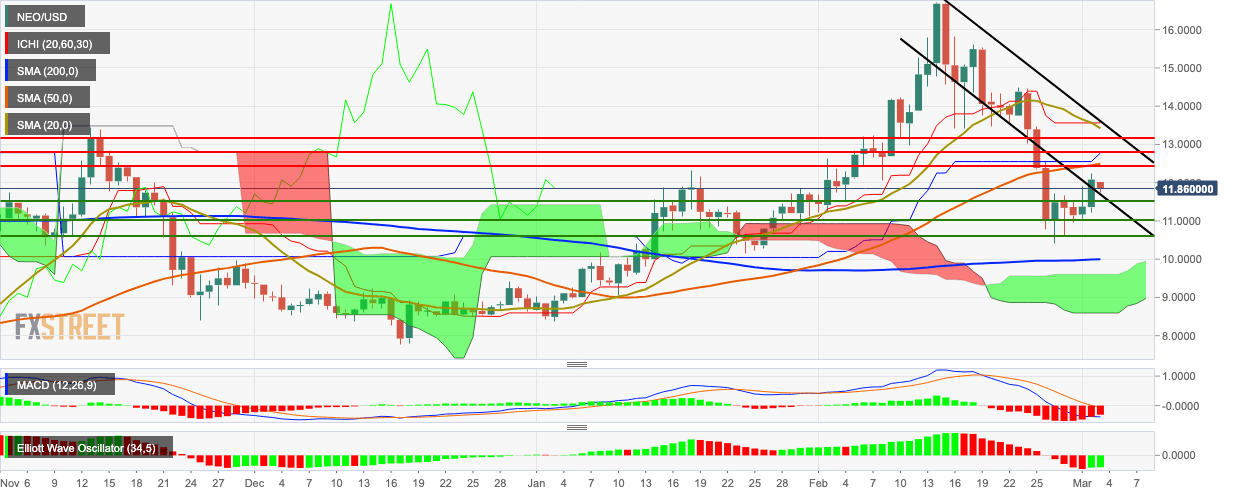
NEO/USD trends in a downward channel formation as the price fell from $12.02 to $11.90 in the early hours of Tuesday and is hovering above the green Ichimoku cloud and the SMA 200. The price had a heavily bullish Monday, where it spiked from $11.37 to $12.08. The MACD indicates decreasing bearish momentum, while the Elliott Oscillator has had two green sessions, following 14 consecutive red sessions.
