- The MACD indicator shows increasing bearish momentum.
- NEO/USD is trending in a downward channel formation.
NEO/USD continued to sink and fell below the 200-day Simple Moving Average (SMA 200). This Thursday, NEO/USD fell from $11.50 to $11.10. Since then, NEO/USD dropped further to $10.95, going below the $11-level. The hourly breakdown of Thursday and Friday shows us that the price fell to $10.65, where it found intraday support and bounced up to $11.23. Since then, the price has settled itself around $10.95.
NEO/USD daily chart
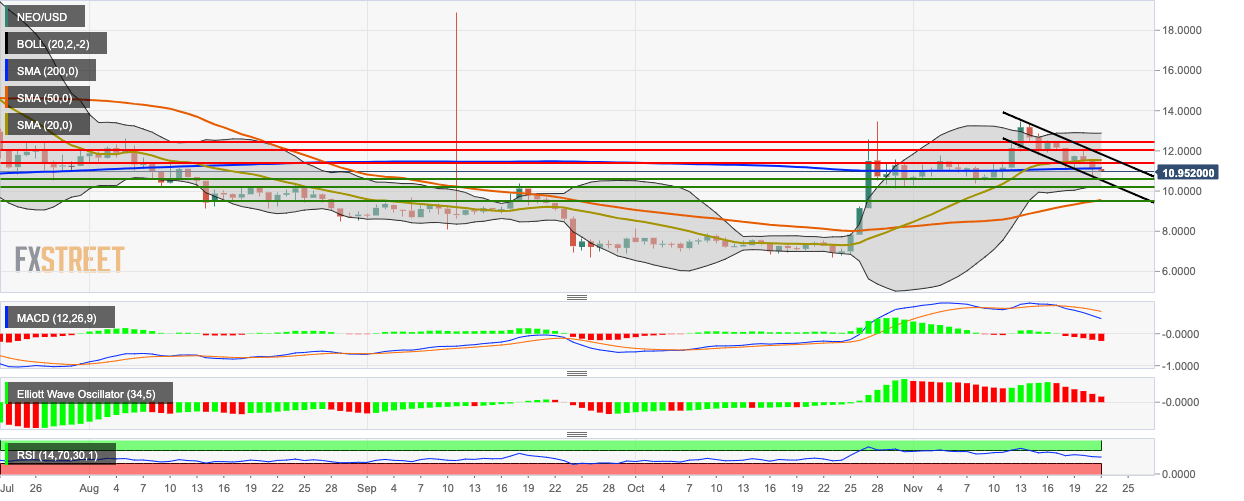
The daily price is trending in a downward channel formation. The Moving Average Convergence/Divergence (MACD) indicates increasing bearish momentum, while the Elliott Oscillator shows six straight red sessions. The Relative Strength Index (RSI) indicator is trending around the neutral zone.
