- NEO price reacts to the double-top pattern but trendline support holds ground.
- NEO upside is still limited below $35.50 for the second day in a row.
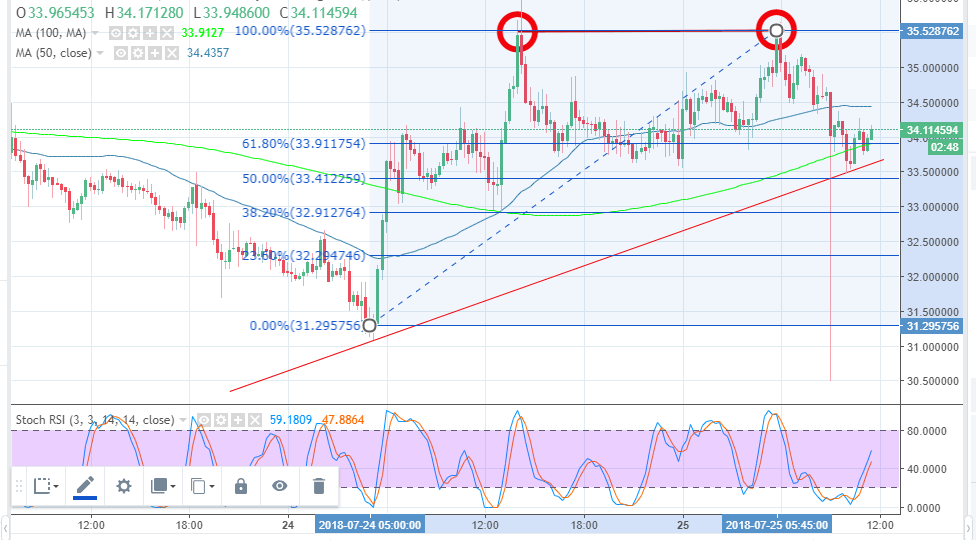
NEO has maintained the uptrend after bouncing off the support at $31.29, although the price reacted lower after failing to break above the resistance at $35.00 for the second time, instead, it formed a double-top pattern. NEO has trimmed gains while reacting to the pattern as observed on the chart. The declines, however, seems to be have been supported at $33.50 (trendline support).
The price is currently flirting with the 61.8% Fibonacci level drawn between the highs of $35.52 and the lows of $31.29 at $33.90. Technical indicators applied to the chart show that there is buying power. For instance, the MACD is starting to bend upwards but still in the negative region. Similarly, the stochastic RSI is advancing north but currently at 52.59%.
The 50 simple moving average on the 15-minutes chart is restricting the movements towards the short-term resistance at $34.43. Although $35.0 is a key breakout position which could allow NEO price to curve the path towards $35.50 and 40.00 in the medium-term.
On the other hand, the 100 simple moving average on the same chart is supporting the price at the 61.8% Fib level. The trendline support which was very instrumental in halting the declines earlier in the day (10:00 GMT) will provide anchorage above the stronger $33.50 support.