NEO/USD Daily Chart
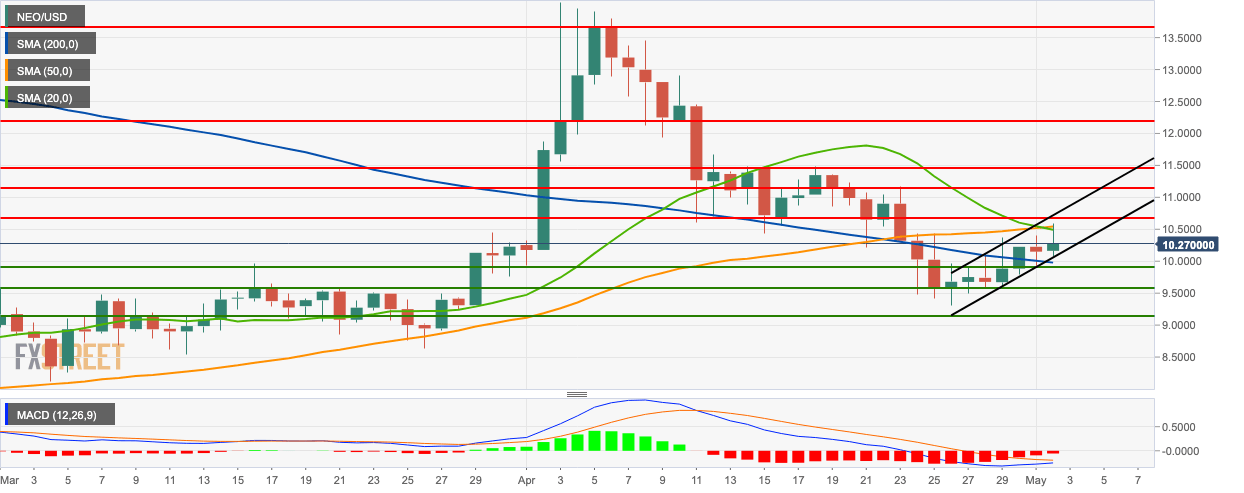
- NEO/USD went up from $10.16 to $10.27 this Thursday.
- The price is currently trending upwards in a channel formation.
- The price is above the SMA 200 curve while still below the SMA 20 and SMA 50 curves.
- The SMA 50 curve has crossed above the SMA 20 curve, which is a bearish sign.
- The signal line is about to converge with the MACD line, showing decreasing bearish momentum.
NEO/USD 4-Hour Chart
-636924364528932763.png)
- The relative strength index (RSI) indicator is trending at 56.25.
- The 4-hour NEO/USD market forms a triangle formation from which the price has had a bearish breakout.
- The market is above the SMA 50 and SMA 20 curves.
- The 4-hour price is trending in a downward channel.
NEO/USD Hourly Chart
-636924364110026549.png)
- The hourly NEO/USD is trending below the SMA 20 curve.
- The hourly price is above the SMA 200 and SMA 50 curves.
- The Elliot oscillator shows seven consecutive bearish sessions.
- The short-term resistance lies at $10.30.
Key Levels
