The New Zealand dollar continued enjoying an improving market mood but eventually reversed course and slid back down. GDP and milk prices stand out. Here is an analysis of fundamentals and an updated technical analysis for NZD/USD.
The better political prospects for the UK helped markets recover and the kiwi took advantage of this. But later, with better US data and some profit taking, the pair dropped.
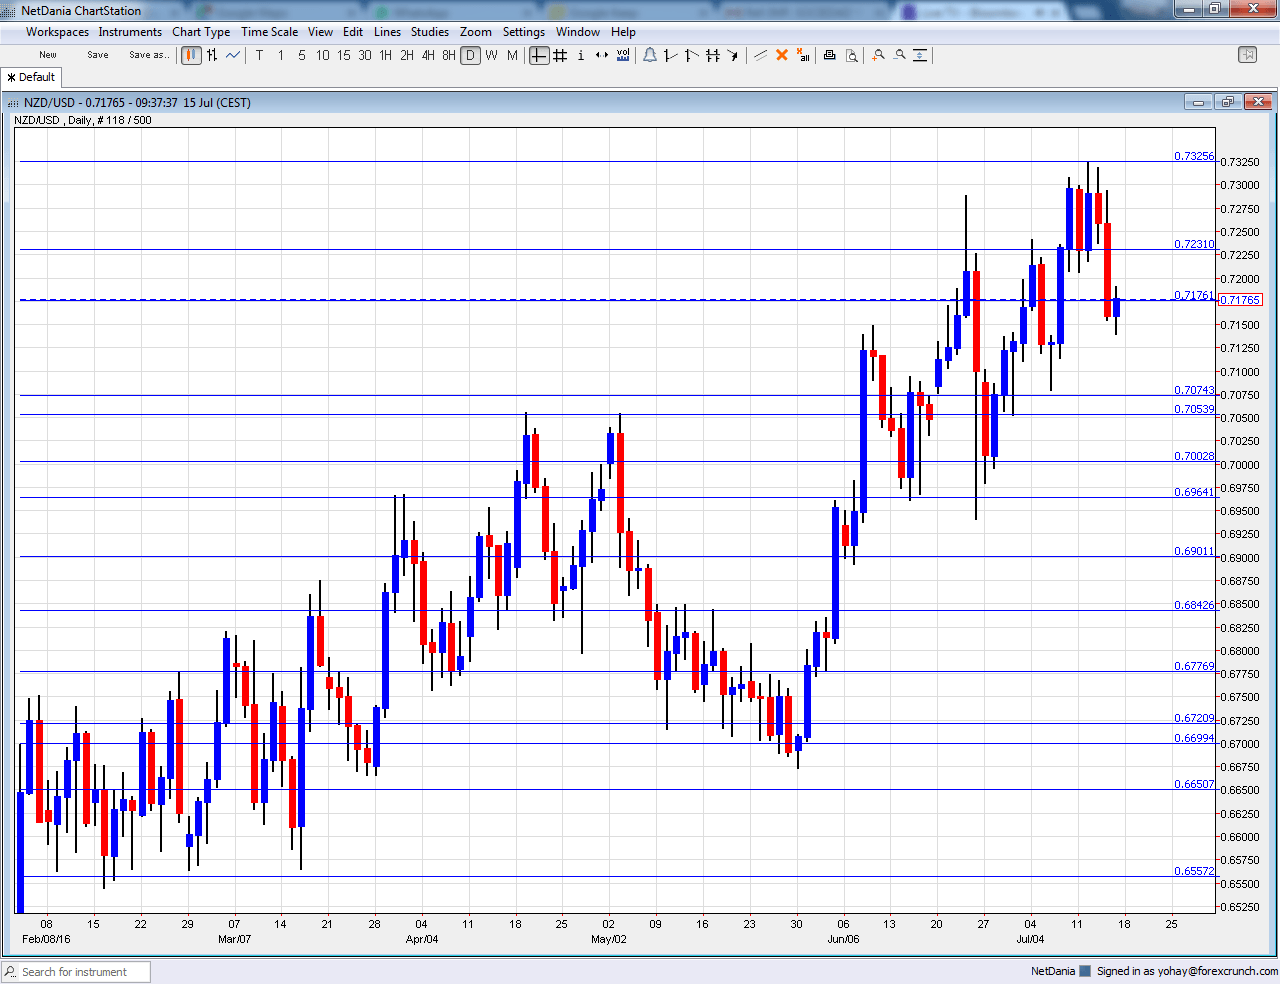
[do action=”autoupdate” tag=”NZDUSDUpdate”/]NZD/USD daily graph with support and resistance lines on it. Click to enlarge:
- CPI: Sunday, 22:45. New Zealand publishes its inflation numbers only once per month, making the report more potent in terms of market reaction. In Q1 2016, prices advanced by 0.2%. While this was a modest rise, at least it was positive after a negative Q4. A rise of 0.5% is expected now.
- GDT Price Index: Tuesday, during the European afternoon. The Global Dairy Trade provides a bi-weekly snapshot about the situation of New Zealand’s main export: milk. The last auction saw a small drop of 0.4%. All in all, recent months have shown stability.
- Visitor Arrivals: Wednesday, 22:45. Tourism also plays a role in the New Zealand economy. A rise of 0.1% was seen in May and a similar small change could be seen now.
- Credit Card Spending: Thursday, 3:00. with retail sales published only once per quarter, this publication provides some additional data. A rise of 5.9% y/y was seen last time, and a slower growth rate is on the cards now.
NZD/USD Technical Analysis
Kiwi/dollar continued moving higher, but struggled with 0.7290 (mentioned last week). It eventually fell to lower ground.
Technical lines, from top to bottom:
We begin from higher ground this time.the round number of 0.74 served as resistance and support back in 2015. 0.7305 is the high of 2016 so far.
0.7290 was the pre-Brexit peak and serves as high resistance. The next line is 0.7240 which capped the pair in July 2016.
0.7160 worked as support when the kiwi was trading on much higher ground in 2014. 0.7050 was the high in April 2015.
The round level of 0.70 is still important because of its roundness but it isn’t really strong. The low of 0.6940 allowed for a temporary bounce.
The round 0.69 level has switched positions to resistance. 0.6840 capped the pair during May 2016 and tops the range. 0.6720 is the low seen in May 2016 more than once providing the lower bound.
The round level of 0.67 that works nicely as support. Another line worth noting is 0.6640, which capped the pair in November.
I am bullish on NZD/USD
The situation in New Zealand still looks positive and after the necessary correction, the rise could resume.
In our latest podcast we explain helicopter money and discuss how Carney Marked up the pound.
