The New Zealand dollar moved by the flute of the RBNZ. GDP and milk prices stand out. Here is an analysis of fundamentals and an updated technical analysis for NZD/USD.
The RBNZ said its word and it certainly helped the kiwi. The central bank not only refrained from cutting rates, but also softened its stance regarding the strong currency. Accompanied by a weak dollar early in the week, the kiwi flew high in the sky. However, this didn’t last too long as the same old greenback made a comeback. What’s next?
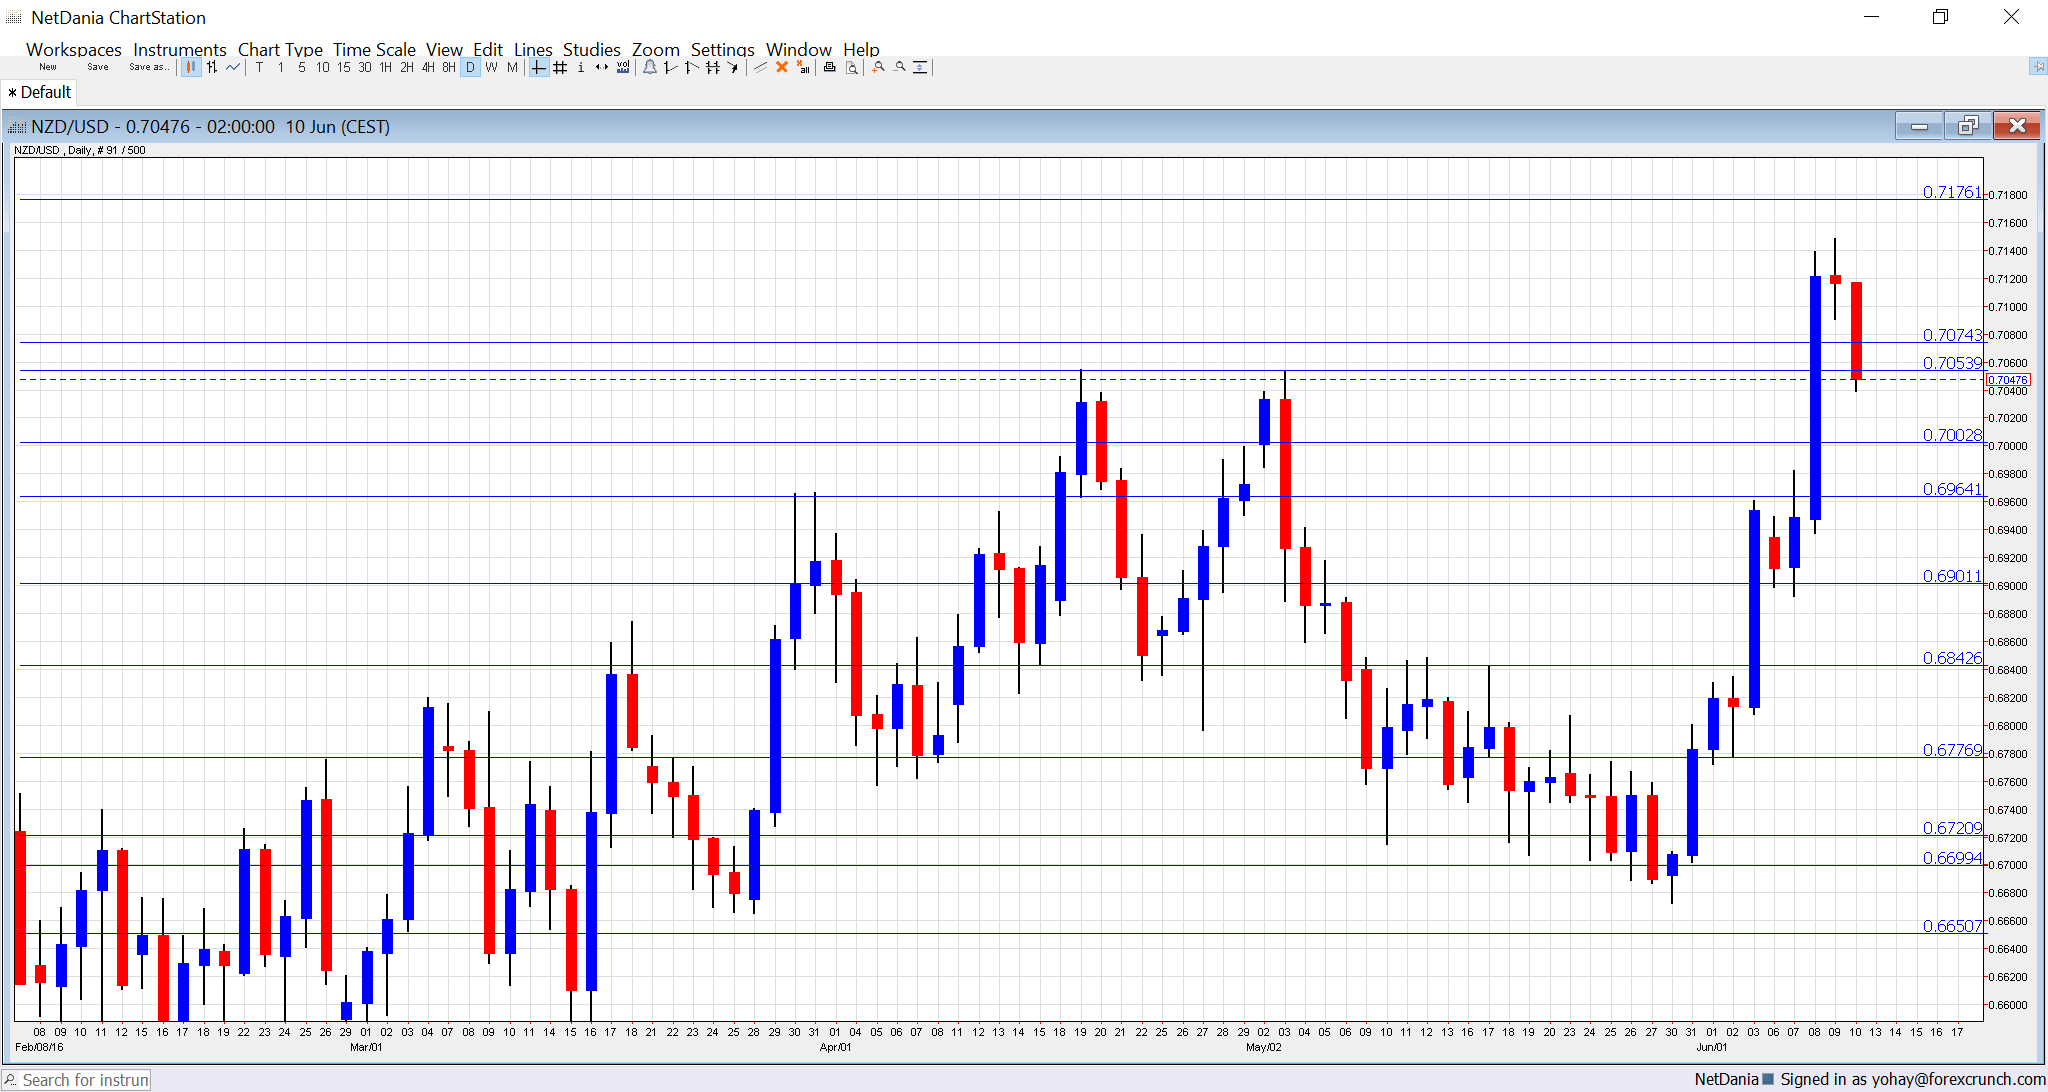
[do action=”autoupdate” tag=”NZDUSDUpdate”/]NZD/USD daily graph with support and resistance lines on it. Click to enlarge:
- FPI: Monday, 22:45. The Food Price Index serves as a warm-up to the GDT Price Index later in the week. A rise of 0.3% was seen in April and perhaps a similar figure will be seen in May.
- Current Account: Tuesday, 22:45. Contrary to the positive trade balance figure, current account is negative. A deficit of 2.61 billion was seen in Q4 2015. We now get the data for Q1 2016 and a positive figure is expected: 0.97 billion.
- GDT Price Index: Wednesday. The Global Dairy Trade is critical for New Zealand as it reflects the price of the nation’s biggest export: milk. Two consecutive rises were seen with 3.4% last time. Will prices fall this time?
- GDP: Wednesday, 22:45. New Zealand’s economy advanced by a very strong 0.9% in Q4 2015. While the data is released quite late in comparison to other countries, it still has a huge impact. Slightly slower growth could be seen now: 0.5% is expected.
- Business NZ Manufacturing Index: Thursday, 22:30. This PMI-like measure has been positive for long months. A score of 56.5 was seen last time.
NZD/USD Technical Analysis
Kiwi/dollar slid from resistance at 0.6940 (mentioned last week).
Technical lines, from top to bottom:
0.7160 worked as support when the kiwi was trading on much higher ground in 2014. 0.7050 was the high in April 2015.
The round level of 0.70 is still important because of its roundness but it isn’t really strong. The low of 0.6940 allowed for a temporary bounce.
The round 0.69 level has switched positions to resistance. 0.6840 capped the pair during May 2016 and tops the range. 0.6720 is the low seen in May 2016 more than once providing the lower bound.
The round level of 0.67 that works nicely as support. Another line worth noting is 0.6640, which capped the pair in November.
The post crisis low of 0.6560 is still of importance. Below, the round 0.65 level is of high importance now, serving as support.
I am neutral on NZD/USD
On one hand, the New Zealand data looks good. However, the comparison between US and New Zealand monetary policies points to a stronger greenback. The picture could remain balanced, albeit volatile.
Our latest podcast is titled Oil, Brexit and the Big Fed Preview
