The New Zealand dollar suffered another week of losses and this time it was certainly due to domestic weakness. There are two interesting events on the calendar. Here is an analysis of fundamentals and an updated technical analysis for NZD/USD.
New Zealand’s trade balance surplus squeezed more than expected to 534 million, but this was only the first blow. The influential ANZ Business Confidence, that reached a multi-decade peak just in February, free fell to 53.5 points. In addition, there are worries that the housing market has come to a full halt. In the US, the Q1 contraction doesn’t look good, but the present the future certainly seem brighter.
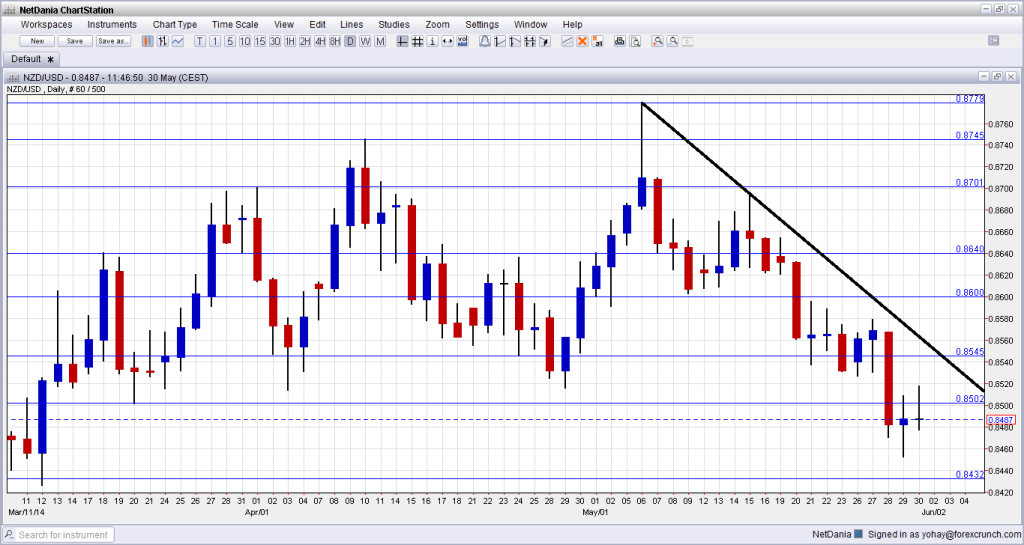
[do action=”autoupdate” tag=”NZDUSDUpdate”/]NZD/USD daily chart with support and resistance lines on it. Click to enlarge:
- Overseas Trade Index: Monday, 22:45. This general indicator provides an insight about the competitiveness of the economy in international trade. In Q4 2013, a rise of 2.3% was recorded, beating expectations once again. This time, a drop is likely for Q1 2014.
- ANZ Commodity Prices: Wednesday, 1:00. As an exporter of food, commodity prices play an important role. After a drop of 4% in April, a more moderate drop is expected now.
* All times are GMT.
NZD/USD Technical Analysis
Kiwi/dollar started the week with an attempt to move higher, but it eventually tumbled down. The loss of the 0.85 line (mentioned last week) proved significant, as the pair could not recapture it.
Technical lines, from top to bottom:
We start from lower ground this time. The previous 2014 peak of 0.8745 will be watched on any upside move. The round number of 0.87 proved its strength during May and joins the chart as key upside resistance.
The older swing high of 0.8640 worked as a pivotal line but eventually capped the pair. It is followed by the round number of 0.86, which worked as a cushion during May 2014.
The low of 0.8550 served as yet another pivotal line in the range. 0.85 is an important and very round number that looks like a clear separator of ranges.
0.8435 was the peak in September and was retested in January. It was a strong double top. 0.8392 served as resistance was a recurring peak between November and February.
0.8335 capped a move higher in December and also had a role in the past. The pair fell short of this line in January 2014. Below, 0.8280 supported the pair in February 2014 and also in the past. 0.82, worked as support several times: in September, October and also in December. It is somewhat weaker now.
Downtrend resistance
As the thick black line on the chart shows, downtrend resistance since reaching a peak in early May. The line could limit any recovery attempts.
I am bearish onNZD/USD
The RBNZ wants a weaker kiwi and now this is supported by weaker data coming from not so convincing milk prices and from housing: two strong areas until recently. With the round trip of business confidence back to the lower levels, the pressure on the kiwi could continue, especially in light of the improving US economy.
More kiwi: NZDUSD Key Reversal Could Trigger Next Rally Higher
Further reading:
- For a broad view of all the week’s major events worldwide, read the USD outlook.
- For EUR/USD, check out the Euro to Dollar forecast.
- For the Japanese yen, read the USD/JPY forecast.
- For GBP/USD (cable), look into the British Pound forecast.
- For the Australian dollar (Aussie), check out the AUD to USD forecast.
- For USD/CAD (loonie), check out the Canadian dollar forecast.
