The New Zealand dollar was on the back foot in the wake of the new quarter, succumbing to the strength of the US dollar. 2 events are lined up today. Here is an analysis of fundamentals and an updated technical analysis for NZD/USD.
The fall of 3% in milk prices after a few strong auctions weighed on the kiwi. Yet it was the surge in the greenback that was responsible for the downfall in NZD/USD.
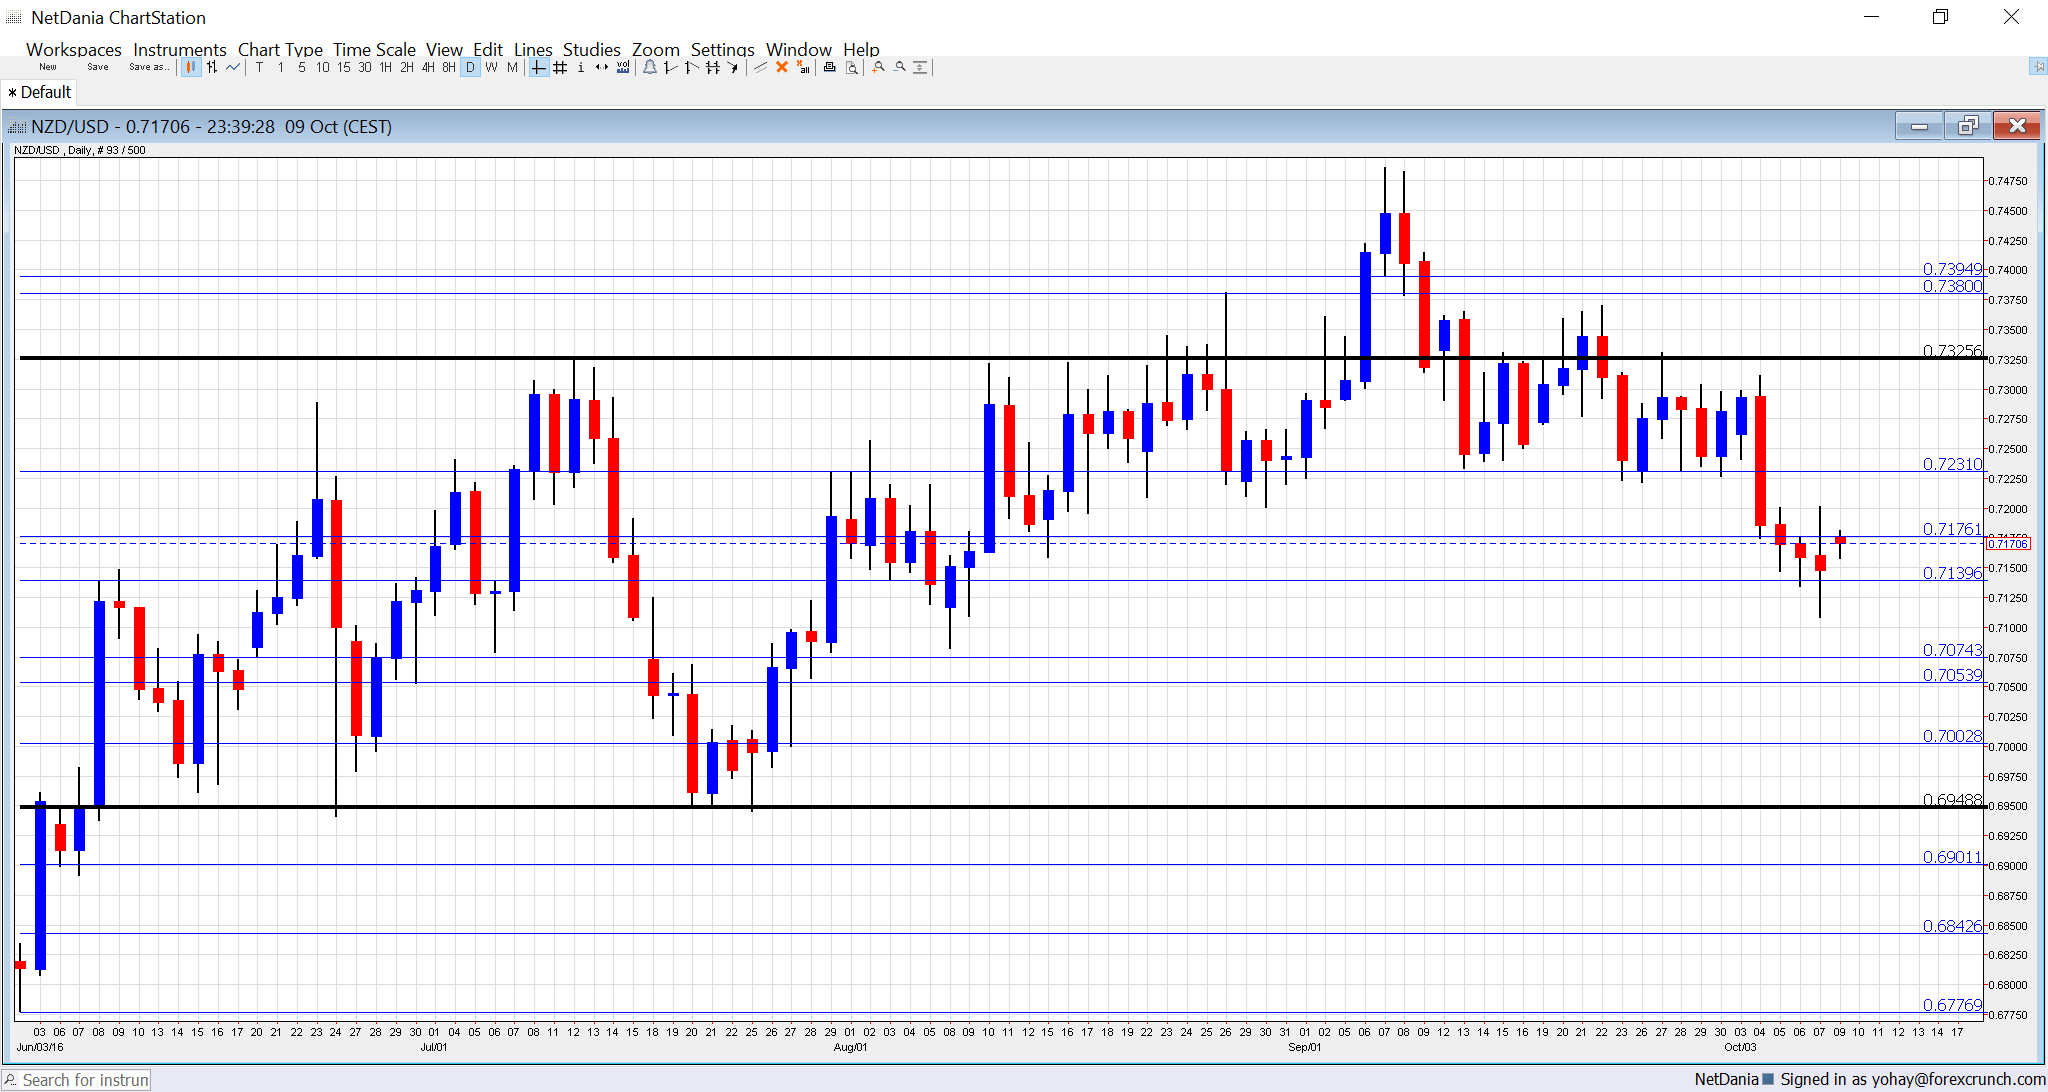
[do action=”autoupdate” tag=”NZDUSDUpdate”/]NZD/USD daily graph with support and resistance lines on it. Click to enlarge:
- Business NZ Manufacturing Index: Wednesday, 21:30. This PMI-like indicator showed solid growth in the manufacturing sector, not New Zealand’s most important one, but a backup for the nation’s main exports. The score is expected to remain similar to 55.1 seen last month.
- FPI: Wednesday, 21:45. The Food Price Index plays a role in moving the currency, as it is related to the milk exports. A significant rise of 1.3% was recorded last time.
NZD/USD Technical Analysis
Kiwi/dollar was pressured to the downside, but survived the dip under 0.7160 (mentioned last week).
Technical lines, from top to bottom:
0.7740 is the high watermark that capped the pair back in April 2015. It is followed by the round level of 0.76. 0.7460 is the high level seen in September 2016.
The round number of 0.74 served as resistance and support back in 2015. 0.7330 is the high of 2016 so far.
0.7290 was the pre-Brexit peak and serves as high resistance. The next line is 0.7240 which capped the pair in July 2016.
0.7160 worked as support when the kiwi was trading on the much higher ground in 2014. 0.7050 was the peak in April 2015.
The round level of 0.70 is still important because of its roundness but it isn’t really strong. The low of 0.6940 allowed for a temporary bounce.
I remain bearish on NZD/USD
The US dollar remains dominant, pushing down risk currencies such as the kiwi. In addition, the RBNZ wants a weaker currency.
Our latest podcast is titled Bold BOJ vs. Fearful Fed
