The New Zealand dollar maintained a safe distance from the highs and seems reluctant to push higher. Nevertheless, it closed the week slightly higher. The first week of the new quarter features the bi-weekly auction. Here is an analysis of fundamentals and an updated technical analysis for NZD/USD.
New Zealand’s trade balance deficit significantly widened, crossing the 1 billion line and weighing on the kiwi. On the other hand, business confidence improved in the nation. n the US, mixed durable goods orders were accompanied by upbeat consumer confidence. US GDP saw a small upgrade in the final read for Q3, but the pace remains slow.
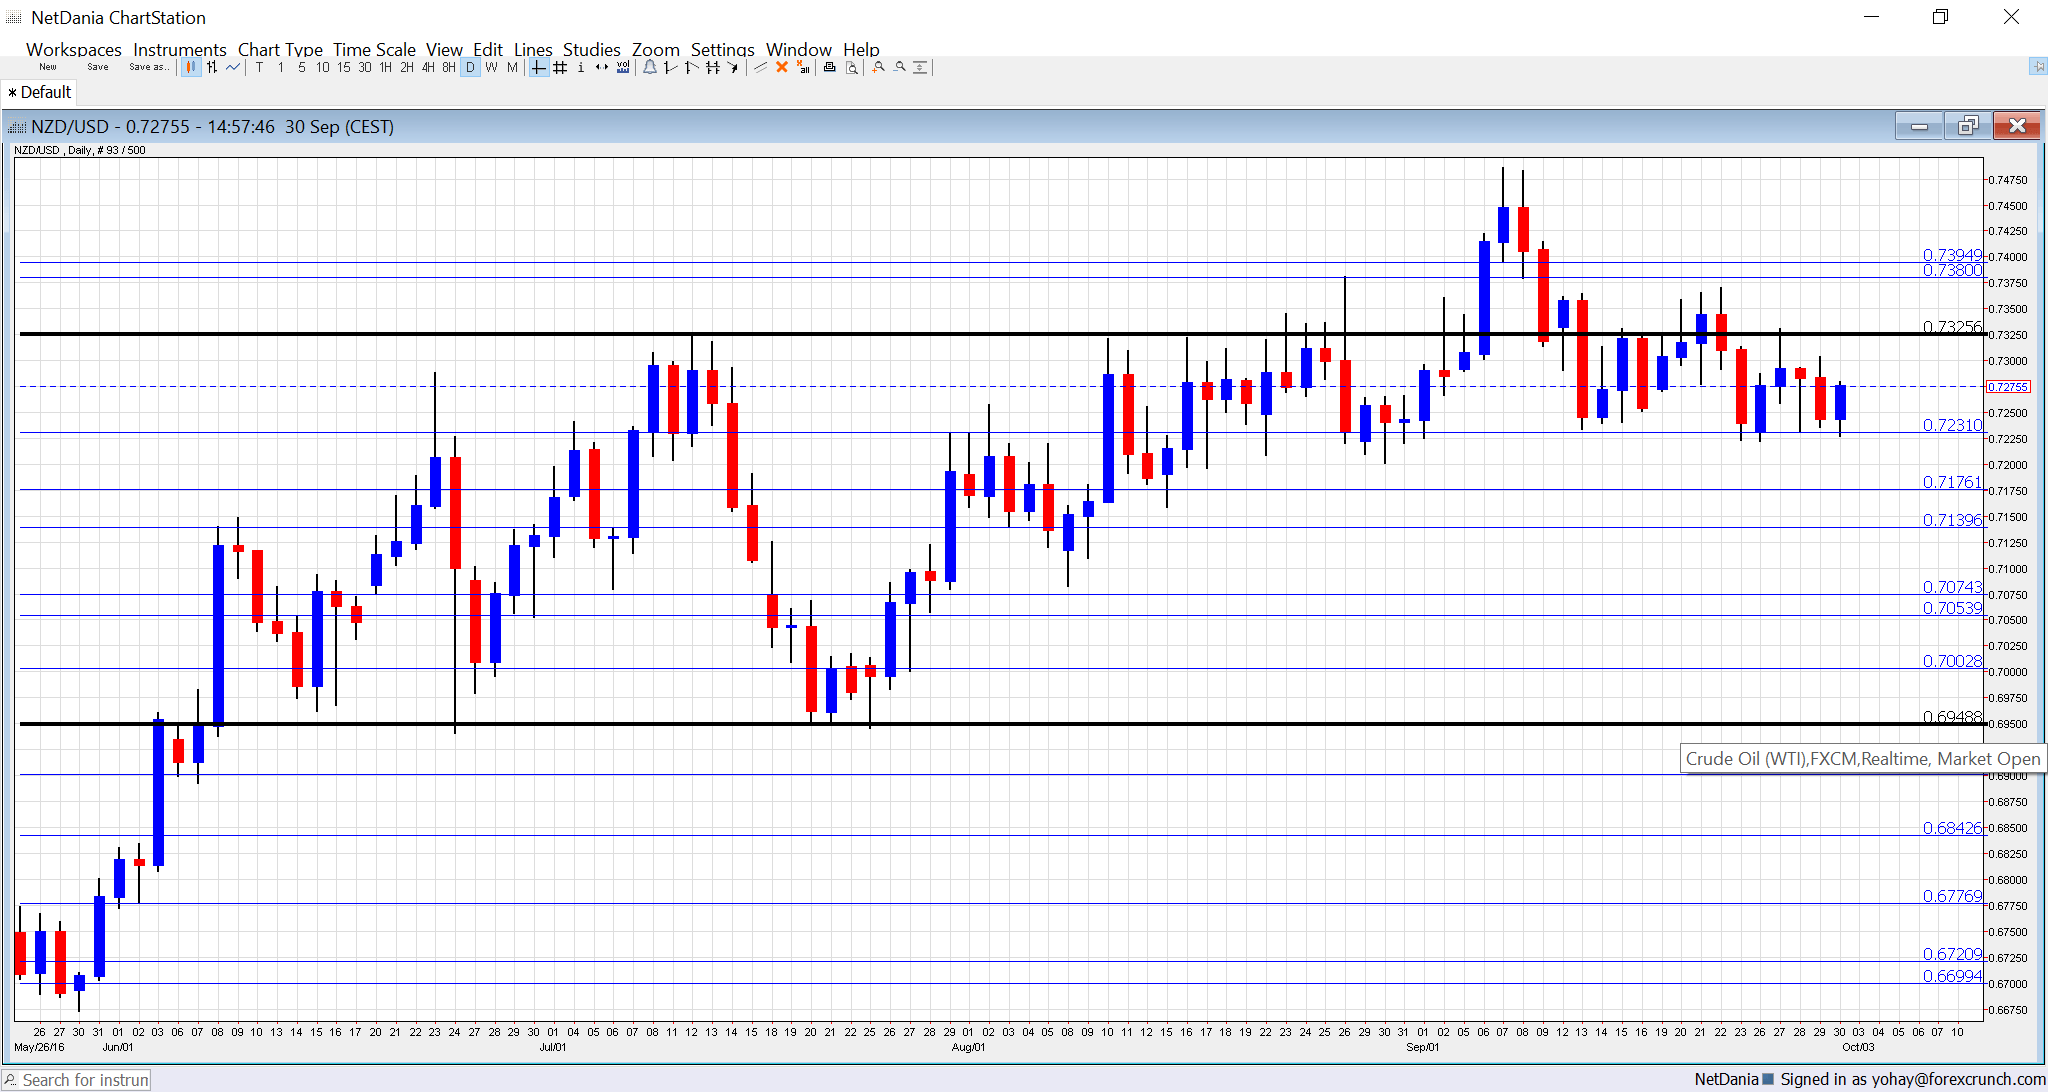
[do action=”autoupdate” tag=”NZDUSDUpdate”/]NZD/USD daily graph with support and resistance lines on it. Click to enlarge:
- Graeme Wheeler speaks: Tuesday, 1:30. The Governor of the RBNZ has recently upped the ante against the strength of the currency. In a speech in Whangarei, Wheeler has another opportunity to hit the currency, while probably remaining upbeat about the economy.
- GDT Price Index: Tuesday, during the European afternoon. The Global Dairy Trade provides a snapshot at milk prices, New Zealand’s key export. After a few mixed readings, the past 4 publications of this bi-weekly indicator saw significant rises in prices, supporting the NZD. After a more moderate rise of 1.7% last time, perhaps we will see a slide this time.
- ANZ Commodity Prices: Wednesday, 00:00. This indicator by the ANZ bank now competes with the GDT publication. Nevertheless, the wider measure of commodity prices is also eyed. In the past four months, it has risen nicely, including an advance of 3.2% in August. We now get the number for September.
NZD/USD Technical Analysis
Kiwi/dollar made an attempt to move higher, but was blocked at the 0.7330 level (mentioned last week). From there, it traded mostly at the 0.72 handle.
Technical lines, from top to bottom:
0.7740 is the high watermark that capped the pair back in April 2015. It is followed by the round level of 0.76. 0.7460 is the high level seen in September 2016.
The round number of 0.74 served as resistance and support back in 2015. 0.7330 is the high of 2016 so far.
0.7290 was the pre-Brexit peak and serves as high resistance. The next line is 0.7240 which capped the pair in July 2016.
0.7160 worked as support when the kiwi was trading on the much higher ground in 2014. 0.7050 was the peak in April 2015.
The round level of 0.70 is still important because of its roundness but it isn’t really strong. The low of 0.6940 allowed for a temporary bounce.
I remain bearish on NZD/USD
Despite the OPEC deal, many remain skeptical, and for the kiwi, it provided little relief anyway. The GDT number could go south this time and US figures will likely remind us that the FED is on course to hike.
Our latest podcast is titled Bold BOJ vs. Fearful Fed
