- OMG is currently trading at $3.58 not able to recover from the recent crash.
- Bulls are allowing OMG to bounce from an overextended hourly RSI.
OMG had a major awakening period on August 15 gaining a ton of trading volume. OMG had around $100 million in daily volume throughout 2020 and managed to peak at $5 billion on August 21 after a massive rally towards $7 from $1.5.
OMG/USD daily chart
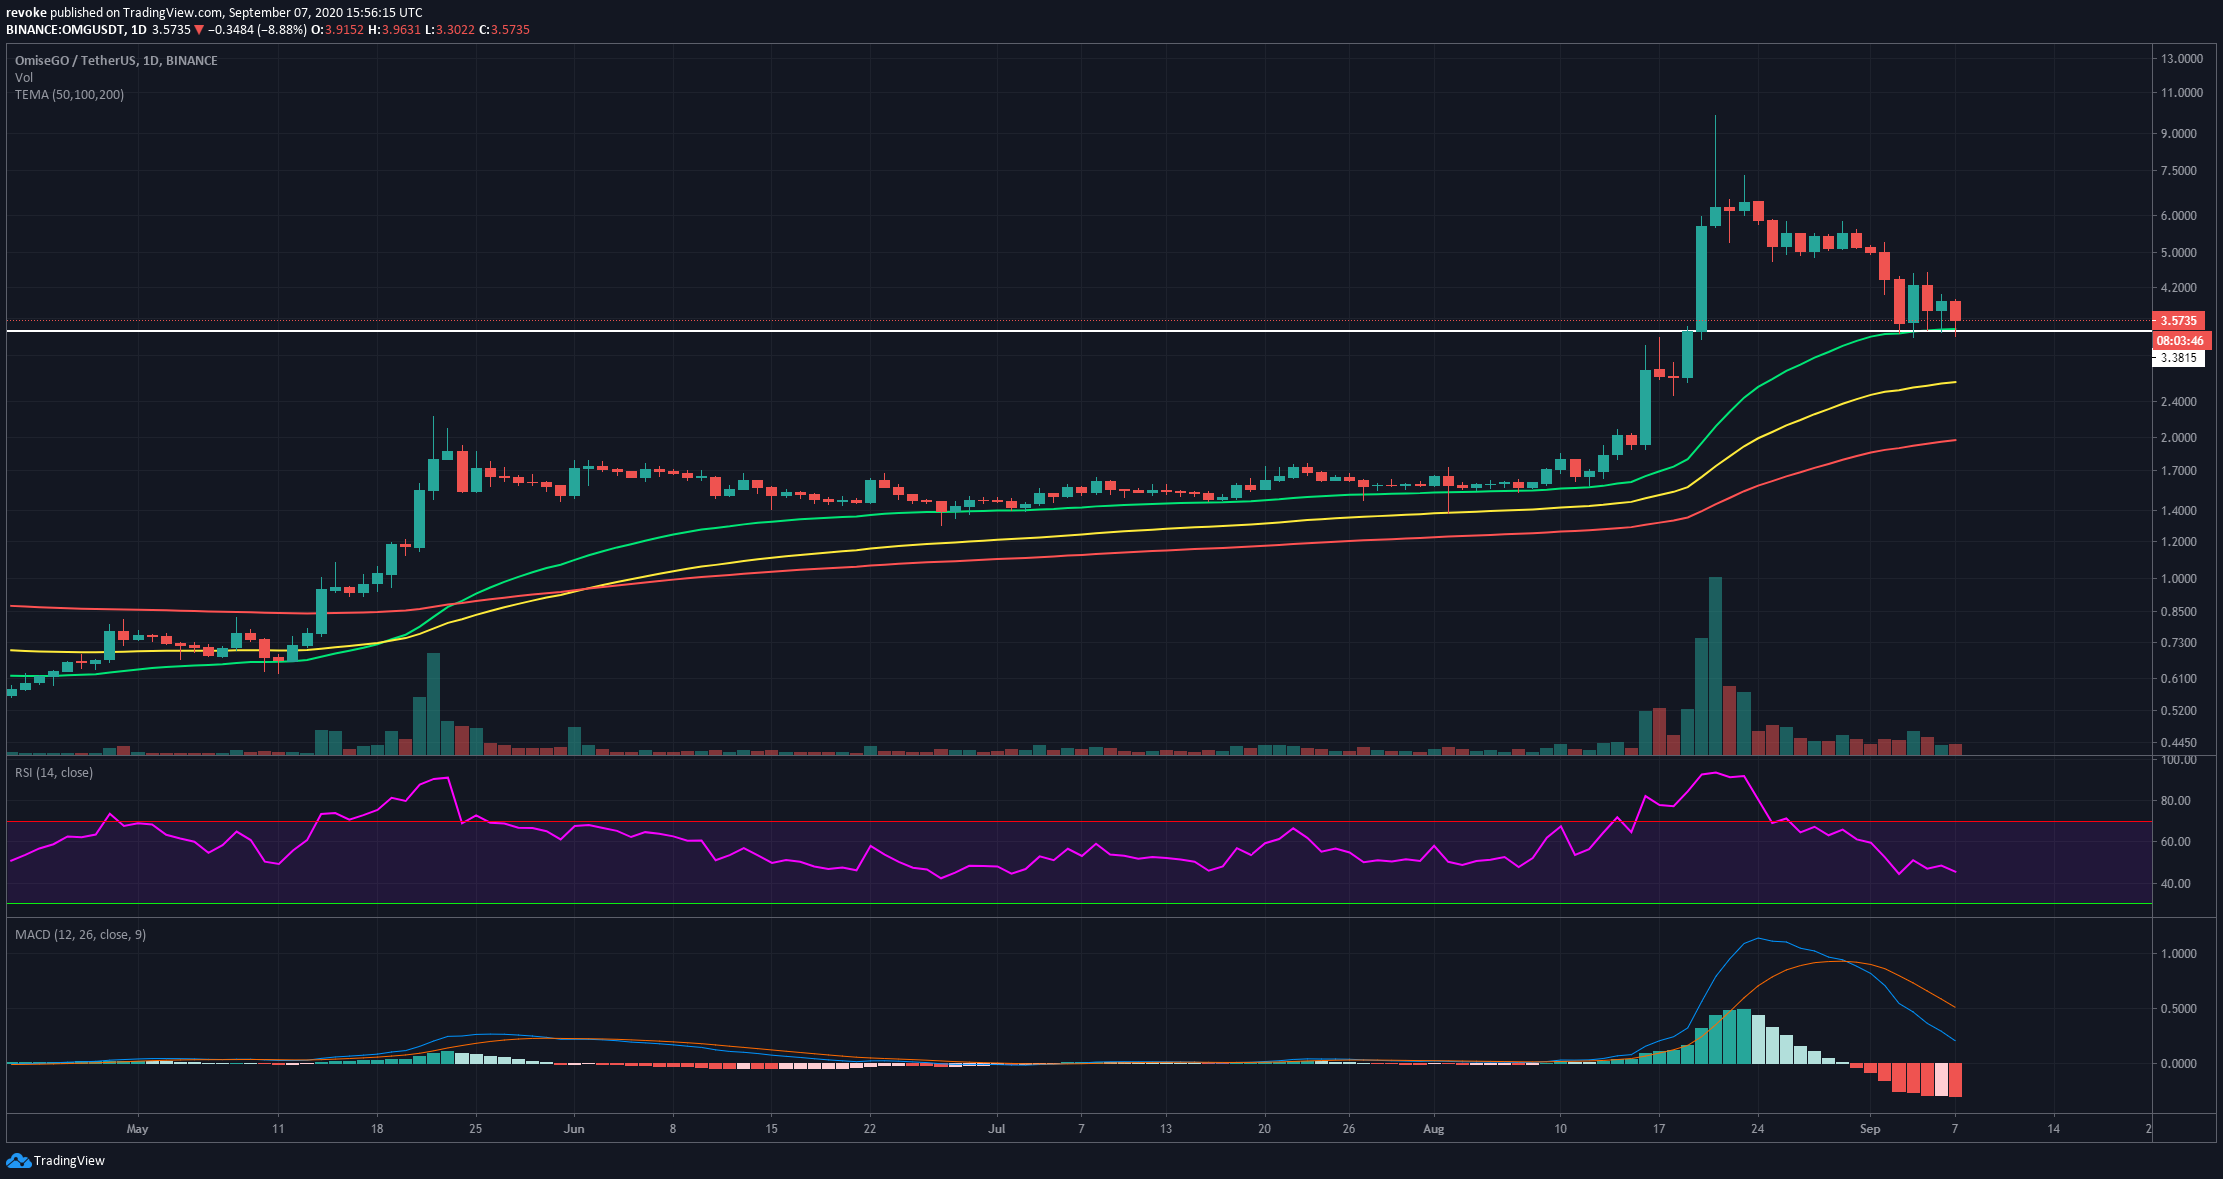
The downtrend for OMG is now clear, however, bulls are defending the daily 50-MA at $3.42 and they have stopped the price from falling below this indicator for five days in a row. The RSI is not yet overextended while the MACD turned bearish around August 30. The significant drop in volume indicates that a bigger move is nearby.
OMG/USD 1-hour chart
-637350913464951582.png)
OMG has quite clearly established a descending triangle pattern on the 1-hour chart forming a robust support line at around $3.4. This can also be seen using the In/Out on-chain metric which shows a lot of addresses buying at $3.39. It also shows a cluster of addresses at $2.96 indicating that $3 would be another crucial area of support if $3.4 is lost. On the other hand, the biggest resistance level at $3.79 only has around 700 addresses together, compared to the 1.68k addresses at $3.4.
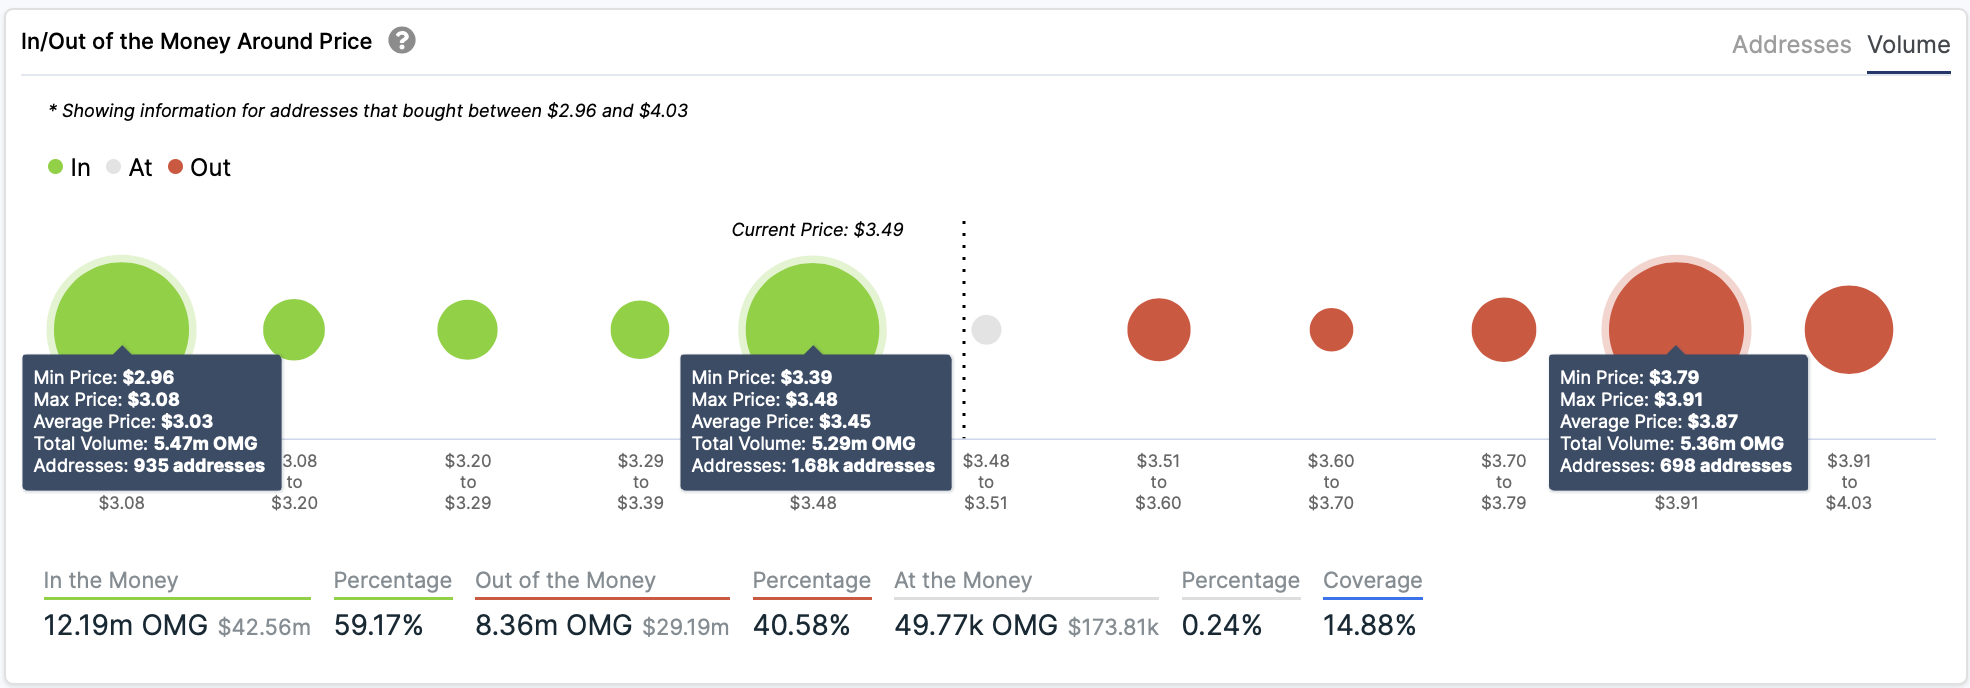
A descending triangle is generally a bearish pattern, however, considering the strength of the support area and the weakness of the resistance level at $3.79, we could see OMG bounce from the lower line of the descending triangle towards $4. Until now, the RSI has given reliable buy signals after overextension.
