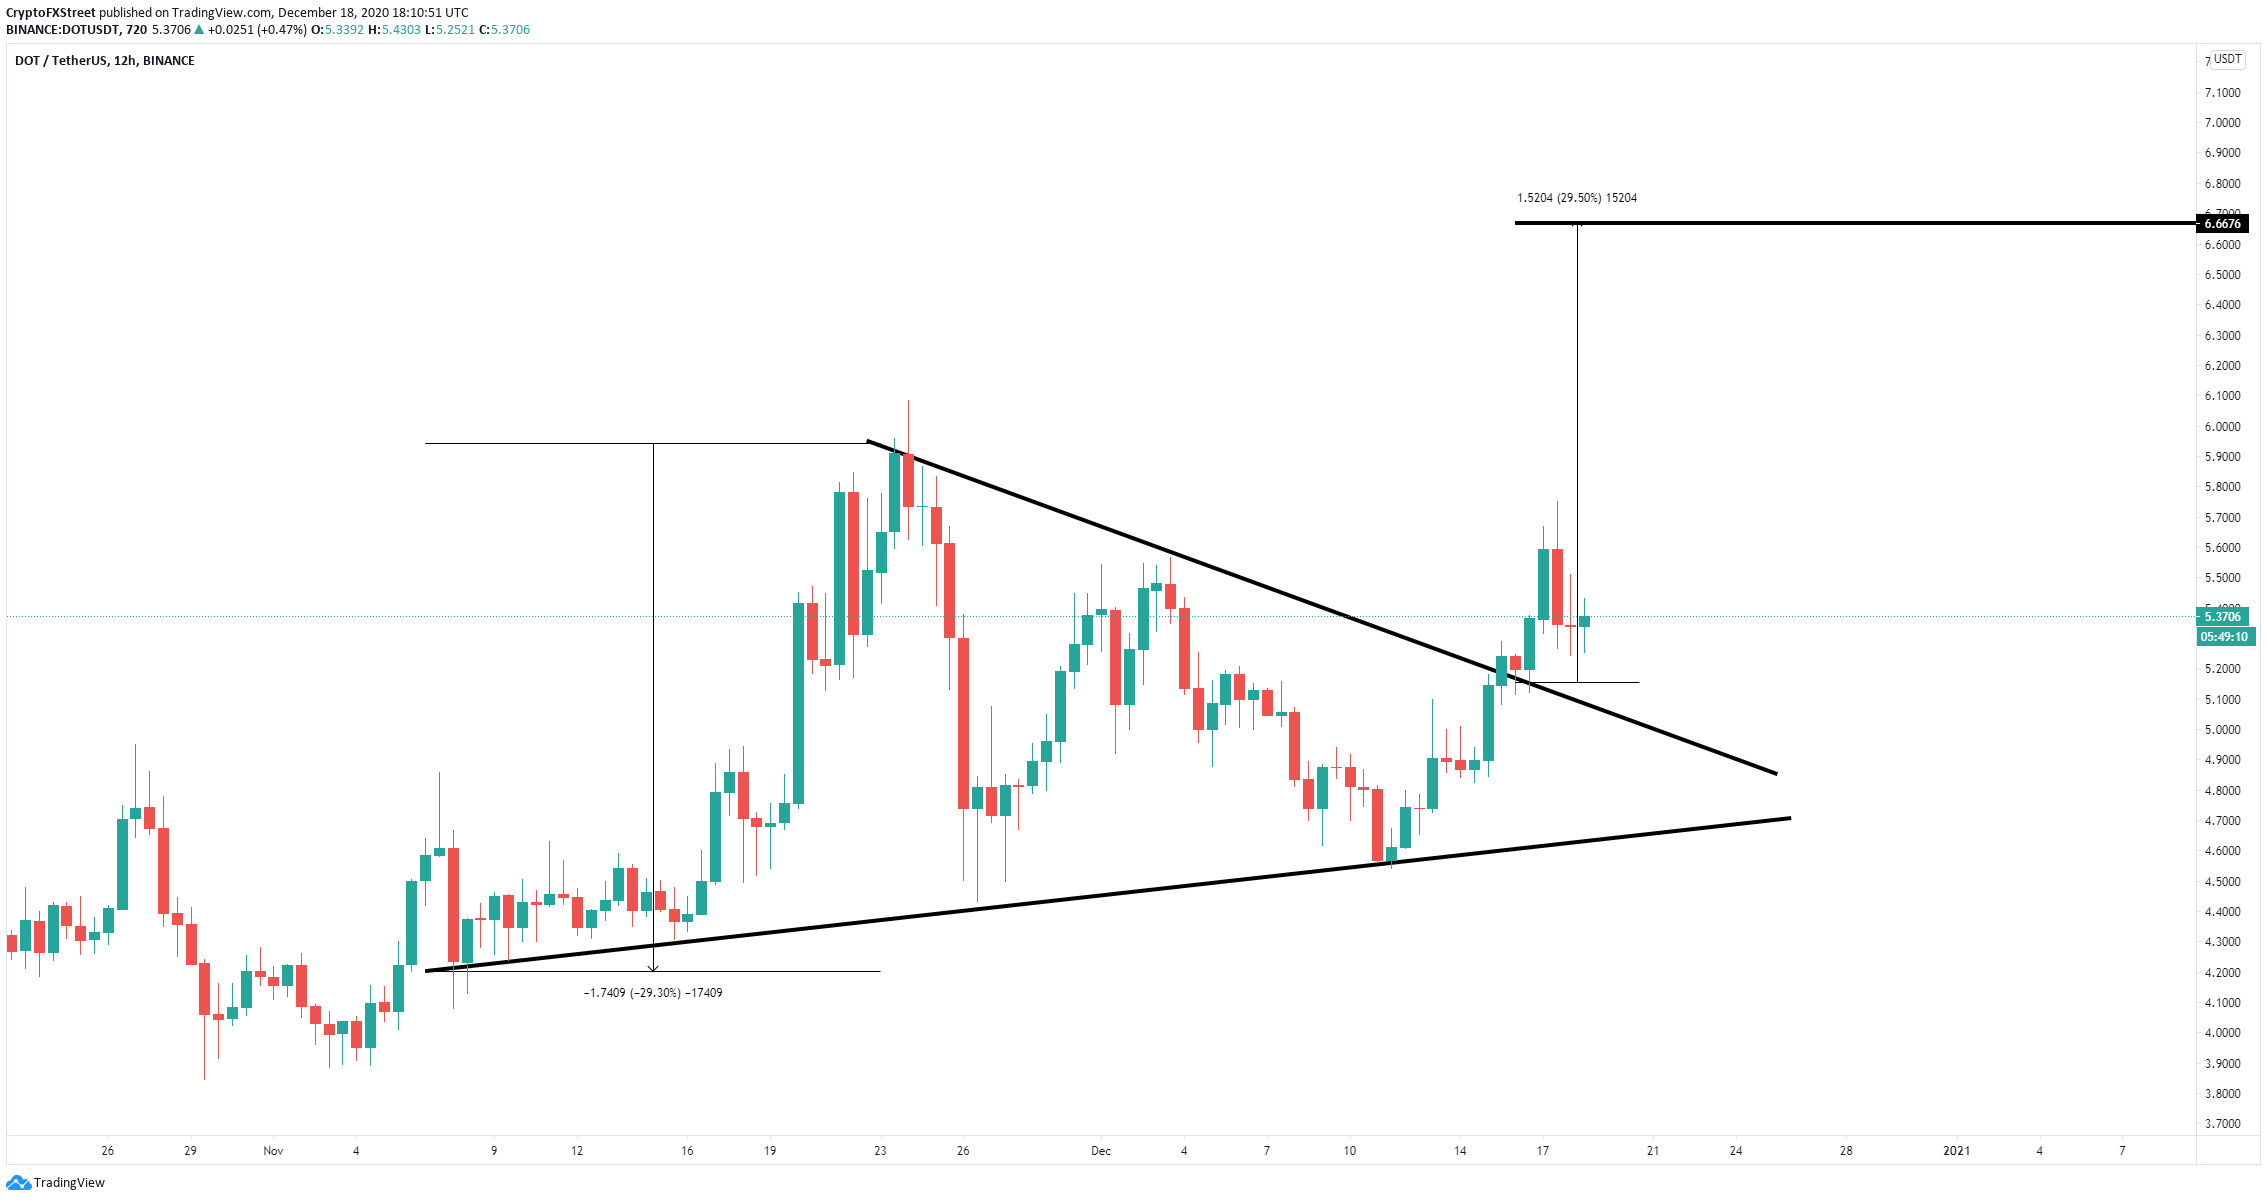
- Polkadot price broke out of a symmetrical triangle pattern on the 12-hour chart.
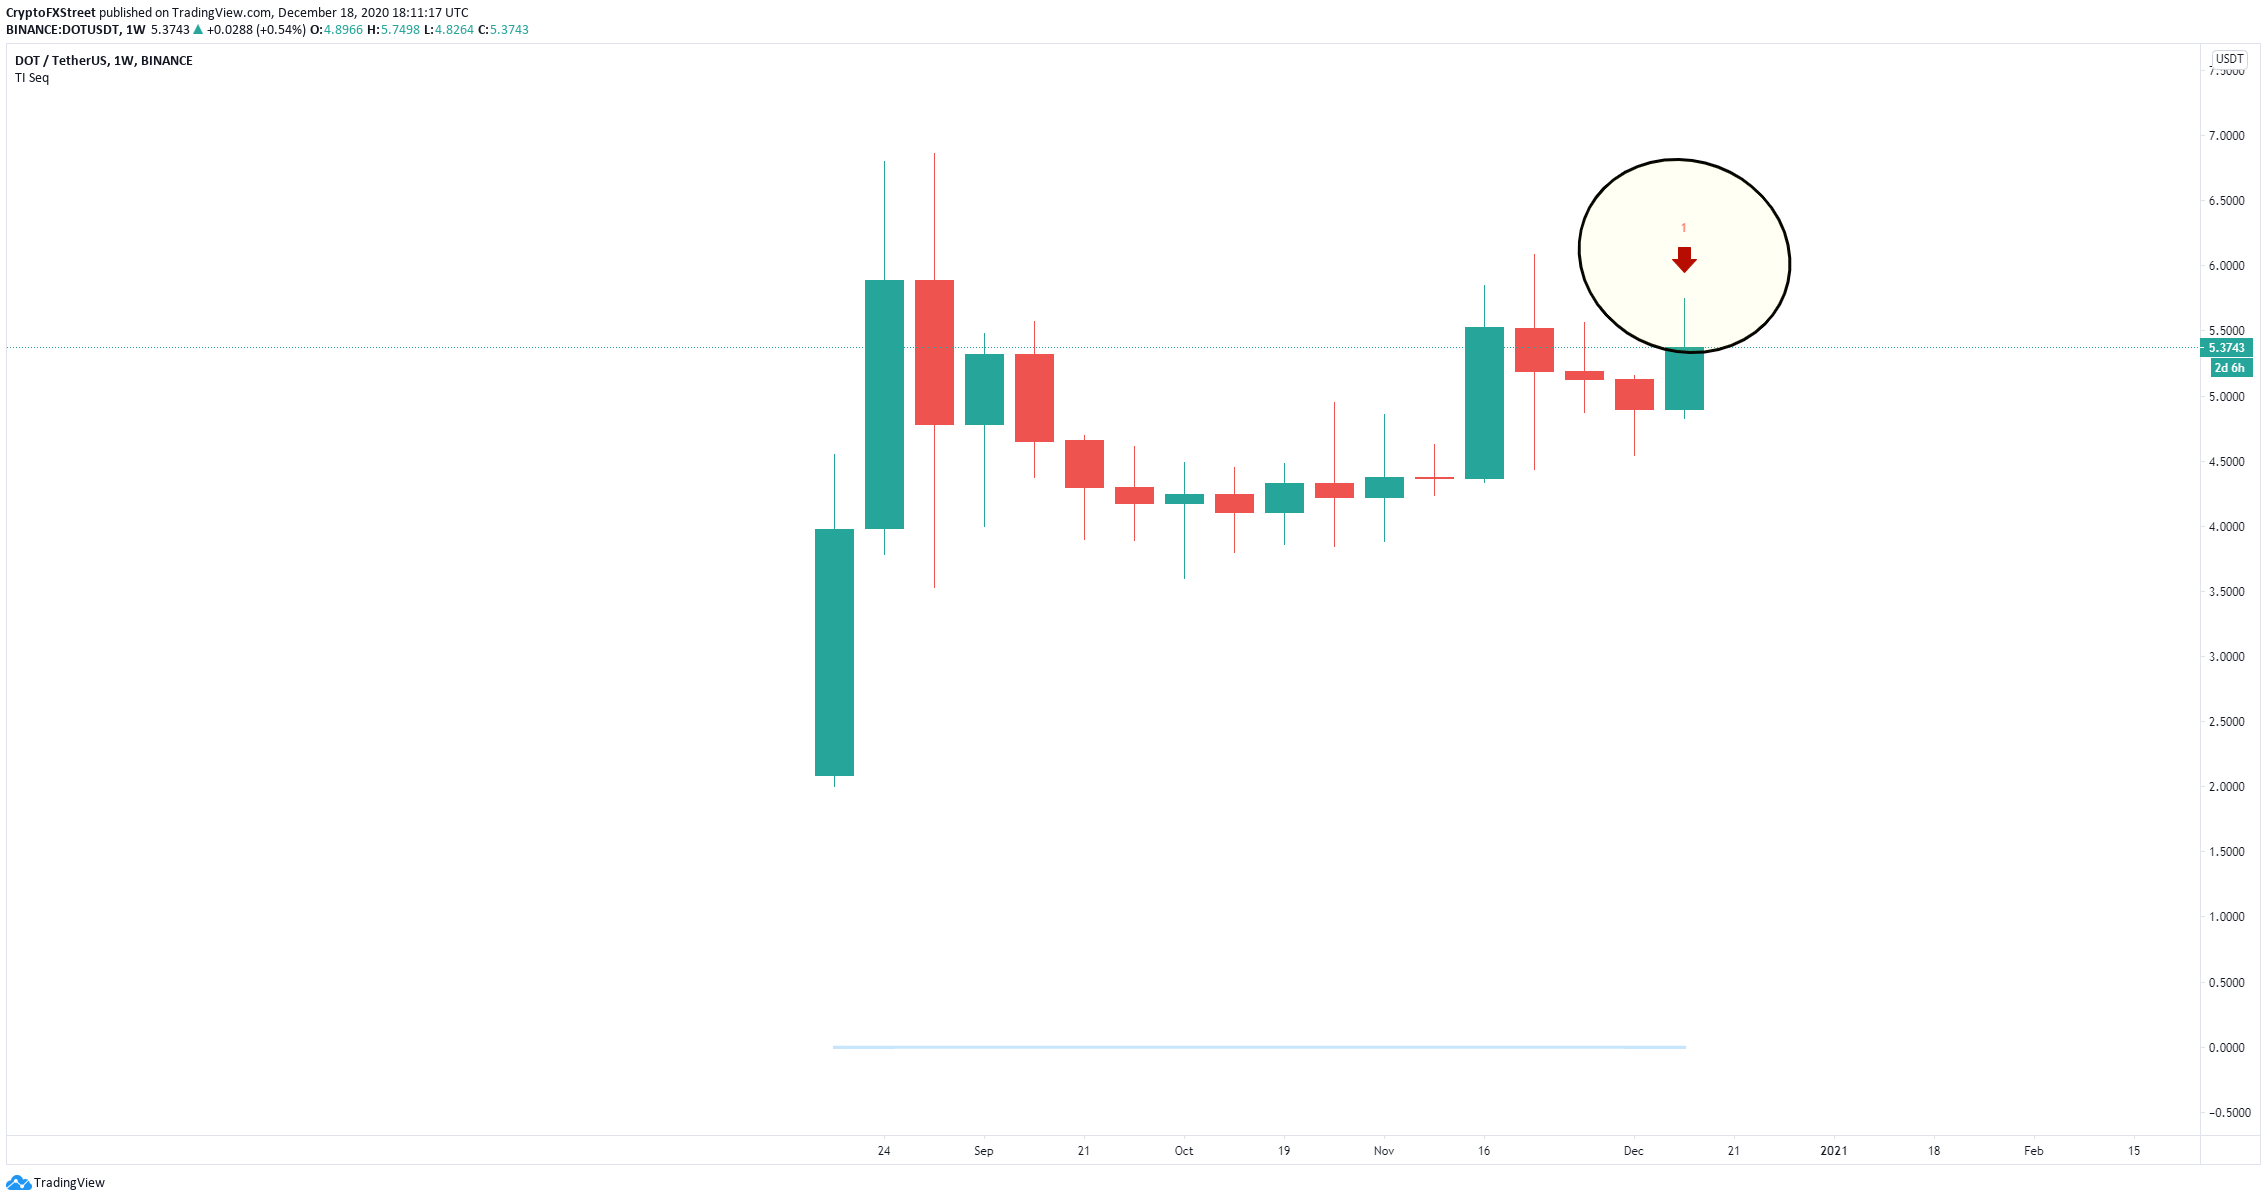
- A critical indicator has presented a sell signal for DOT on the weekly chart.
Polkadot was trading inside a symmetrical triangle on the 12-hour chart, from which it broke out on December 15 seeing a ton of continuation. The digital asset hit a high of $5.74 before retracing towards $5.24 but it might need to pull back harder.
Polkadot price faces strong selling pressure
Breaking out of the symmetrical triangle pattern on the 12-hour chart was certainly a bullish indicator. However, quite often an asset will drop back to re-test the upper trendline of the pattern before jumping higher.
DOT/USD weekly chart
However, on the weekly chart, the TD Sequential indicator has presented a sell signal for the first time ever. This can quickly drive Polkadot price towards the upper trendline support of the previous pattern at $5.
DOT/USD 12-hour chart
Nonetheless, the entire cryptocurrency market has turned bullish in the past 48 hours with Bitcoin breaking all-time highs. So far, the bulls continue with their plan to push Polkadot price towards the high of $6.66 which is a 30% jump from the breakout of the symmetrical triangle pattern.
