- The Polkadot price rallies 33% over the last 7 days to set a new four-month high above $33.
- DOT trades in a tight range between $31.05 and $33.97.
- Polkadot is bearish in the short-term as validated by technical indicators on the four-hour chart.
The Polkadot price has risen 33% over the last seven days to record a four-month high at $33.75 on September 02. The DOT price has been rejected by the $34 level since September 01 as seen on the four-hour chart. A break above this level will trigger buy orders that will see Polkadot go above the $40 psychological level to tag new highs.
Polkadot price trades in a tight range between $33.75 and the 20-SMA
DOT price action has been uneventful over the last three days. This is validated as the horizontal price action that the Polkadot price is displaying on the four-hour chart, market consolidation. Since September 01, the Polkadot price has been trading in a tight price range between a high of $33.97 and the 20-period Simple Moving Average (SMA) at $31.05.
The horizontal movement of the DOT price is accentuated by the horizontal movement of the Moving Average Convergence Divergence (MACD) indicator.
A look at the four-hour chart shows that the short-term Polkadot price prediction is bearish. This is validated by the fact that DOT is currently trading in the red at $32.45. Note that if Polkadot closes the session below today’s intraday low at $31.05, it will lose the support provided by the 20 SMA. If this happens, the asset might be forced to re-test the $30.0 support wall. A daily closure below this level could see DOT revisit the 50 and 100 SMAs currently at $27.90 and $27.07.
DOT/USD Four-Hour Chart
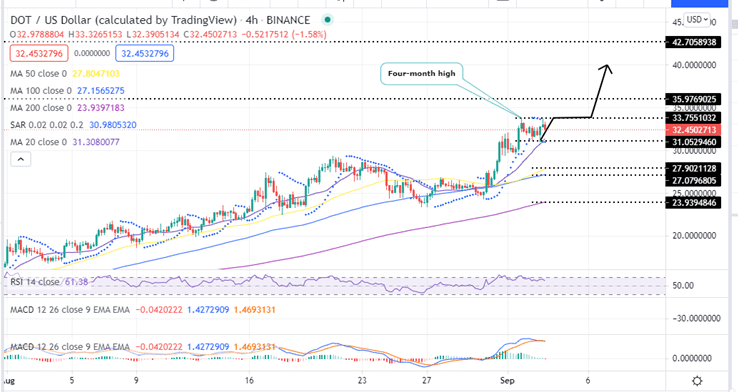
Note the downward movement of the Relative Strength Index (RSI) away from the overbought zone showing that the bears are in control of Polkadot.
Moreover, the Moving Average Convergence Divergence (MACD) indicator has just sent a call to sell crypto signal. This happened earlier today when the 12-exponential moving average (EMA) (blue line) crossed below the 26 EMA (orange line) indicating that Polkadot is bearish over the next trading sessions.
However, if DOT price favours bulls and close the day above the four-month high around $33.75, Polkadot may rally to discover new highs above $40. However, DOT would need to overcome the $35.97 major resistance first before rallying further.
Note that the position of the MACD in the positive region above the zero line validates Polkadot’s bullish bias. Moreover, the MACD sent a call to buy signal on August 31 on the daily chart indicating that the long-term price prediction for Polkadot is bullish.
Where To Buy DOT Cheap?
If you want to buy Polkadot, you can register and start trading on top exchanges such as: eToro, FTX, Binance and Coinbase. You can find others listed in our crypto trading platforms guide.
Looking to buy or trade Polkadot now? Invest at eToro!
Capital at risk
