- Polkadot price is bounded inside a symmetrical triangle pattern on the 4-hour chart.
- The digital asset is trading between two key levels that will determine its future.
- Current price action could be favoring the bears as they are closer to a breakdown.
Polkadot price has been trading inside a tightening pattern and awaits a clear break. It seems that bears might have the upper hand currently as they are closer to a breakdown.
Polkadot price needs a clear breakout or breakdown
On the 4-hour chart, Polkadot formed a symmetrical triangle pattern that can be drawn connecting the lower highs and higher lows. The critical resistance point is located at $44.2 and support at $40.4.
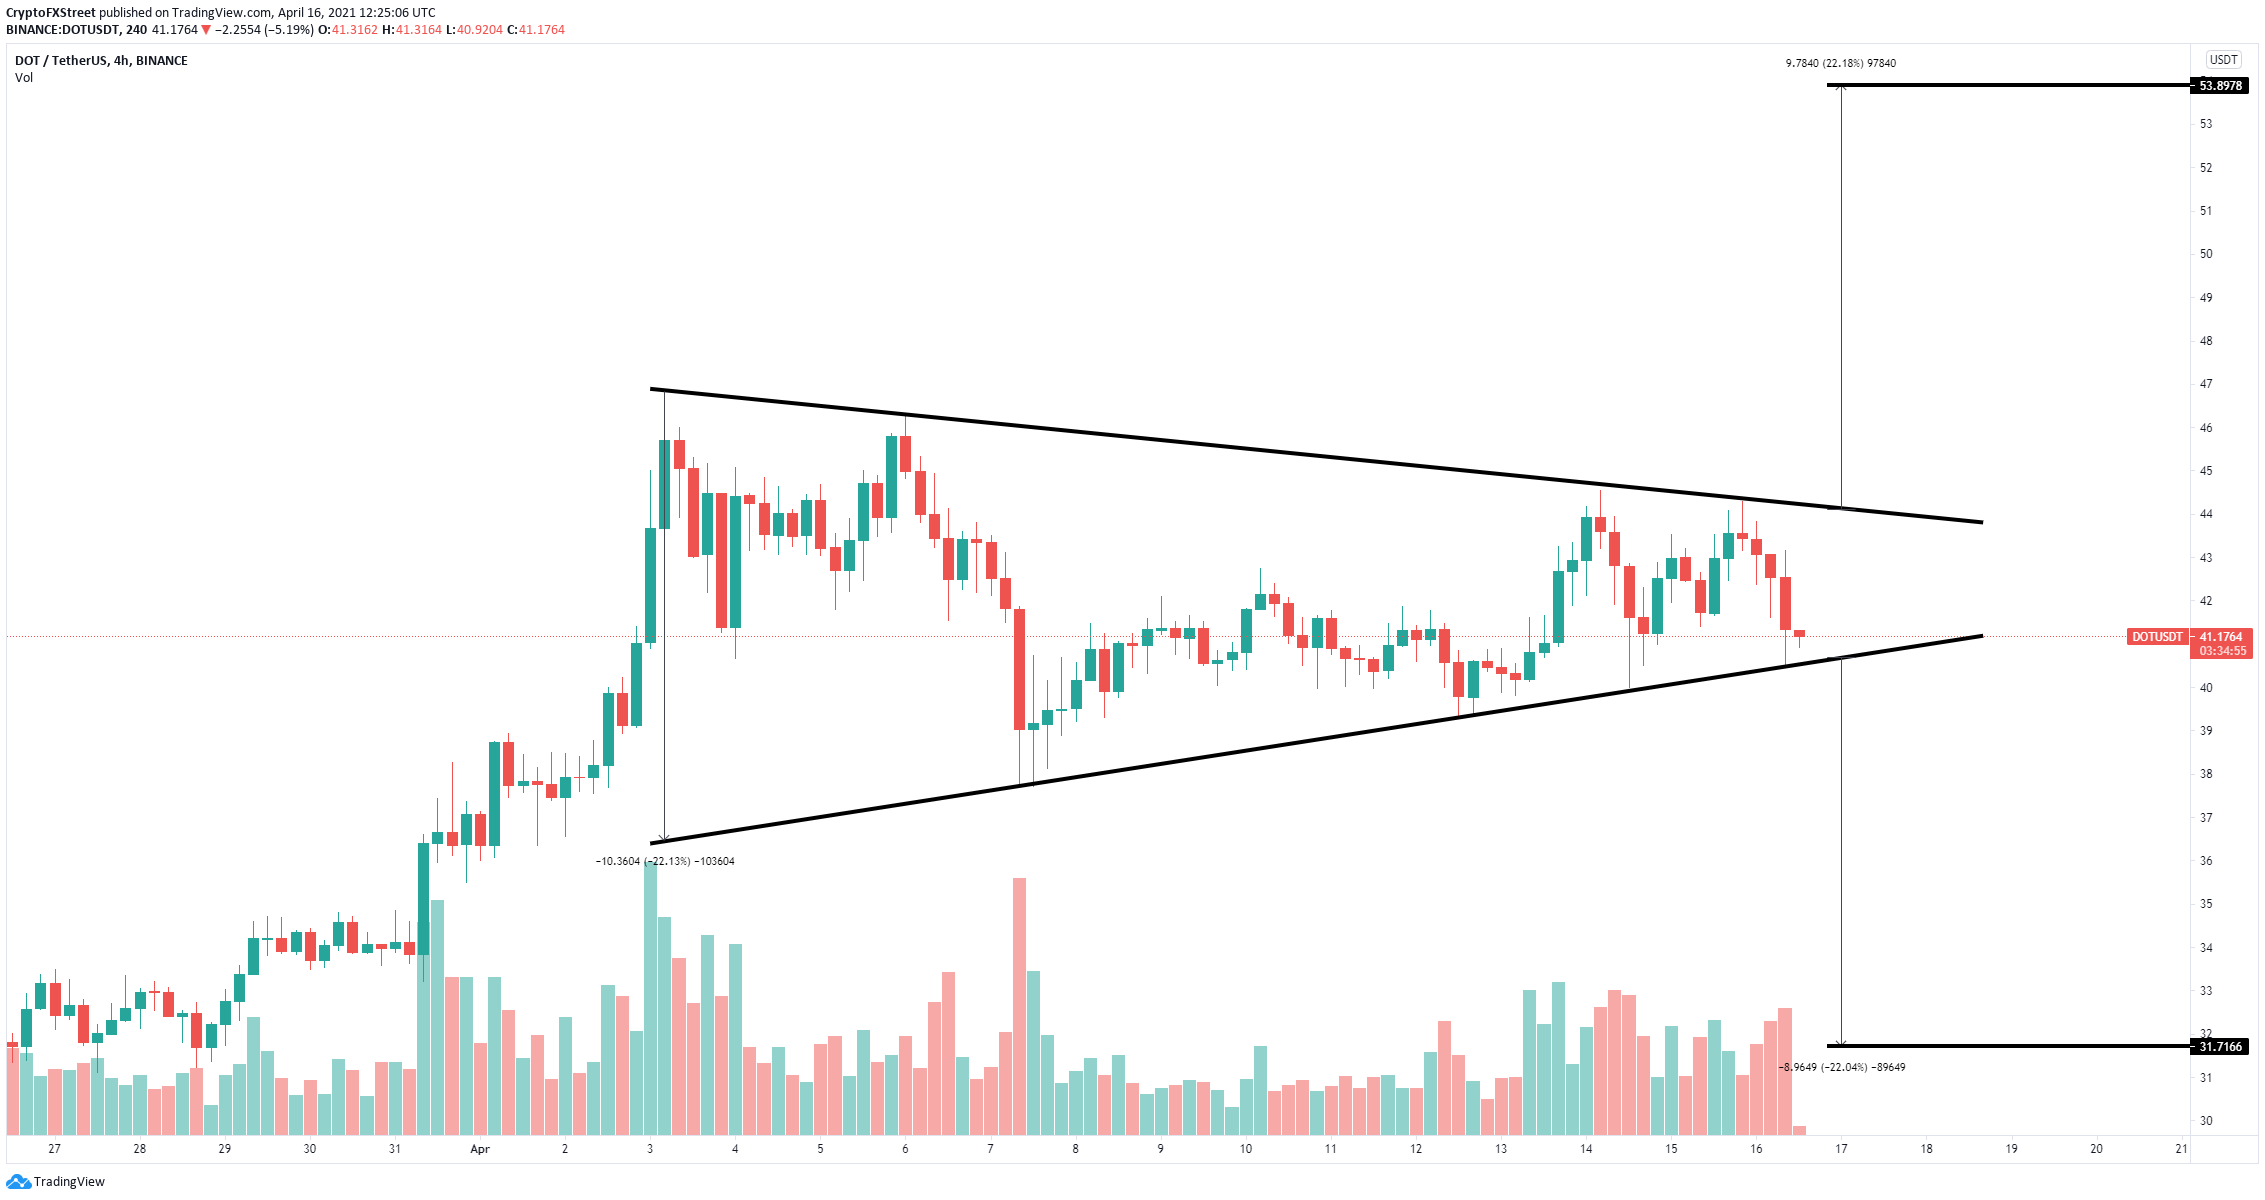
DOT/USD 4-hour chart
A 4-hour candlestick close below $40.4 would confirm a breakdown that has a price target of $31.7, a 22% move calculated by measuring the height between the start of the upper trendline to the beginning of the lower one.
Bears have several price targets in between at $39.2 and $37.8, both previous lows established in the last week.
If bulls want to have a chance of a breakout, they need to defend $40.4 and push Polkadot price toward the upper trendline at $44.2.
Climbing above this key resistance level should drive Polkadot price toward $53.9. The initial price target is the previous all-time high at $46.8 and then the psychological level at $50.
