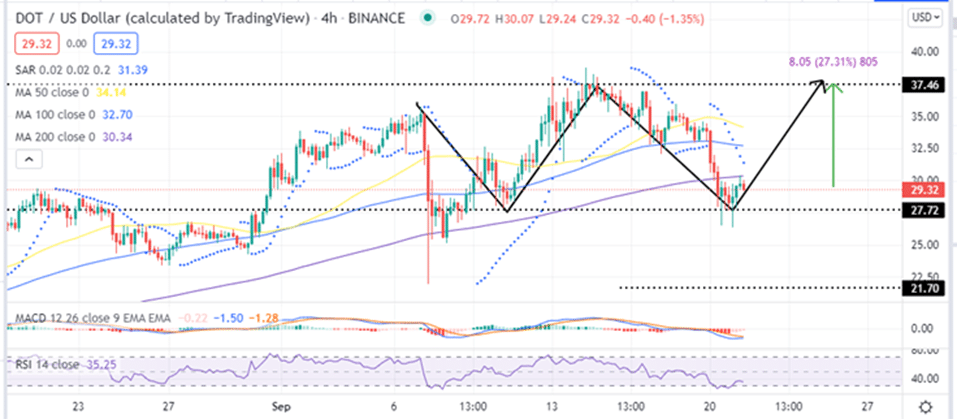
- Polkadot price appears to be preparing for a massive recovery from a slump to $27.72.
- A double-bottom technical pattern prepares DOT for an upswing targeting $37.46.
- Polkadot must close the day above the $27.72 support line to sustain the recovery.
Polkadot price is exchanging hands 5.36% higher than the recently tested support around $27.72. The DOT bulls are focused on undoing yesterday’s losses that gripped the entire market yesterday. Polkadot was caught up in Evergrande sell-off that swept through the global markets on September 20.
DOT dropped as much as 22% to lows of around $26.55 (down 1% over the last 24 hours) and is currently trading at $29.32.
The drop followed a major decline in US stocks on Monday, as Wall Street traders’ fears turned to China’s Evergrande. Investors have been gripped by fear over the looming crisis of the largest Chinese real estate company, that is struggling to manage its $300 billion mountain of debt.
The S&P index (SPX) and the Nasdaq index (COMP) recorded the worst performance since may, while the Dow Index (INDU) logged its worst day since July.
Evergrande’s struggles have been characterised by analysis as a major test for Beijing, with some referring to it as China’s Lehman Brothers moment that could send shockwaves across the world’s economies.
- If you are seeking to buy Polkadot, this list of crypto brokers might be helpful.
Polkadot Price Nurtures a Double-Bottom Recovery Pattern
DOT/USD price appears to have formed a double-bottom pattern on the four-hour chart after the sell-off was halted at $27.72. This level is embraced by the 200-day Simple Moving Average (SMA) on the daily chart. A double-bottom is an exceptionally bullish chart pattern that often results in a trend reversal.
Note that this pattern forms when an asset tests a support level twice without breaking below it. The two bottoms are usually separated by a moderate peak as shown on the DOT/USD four-hour chart.
A breakout from this technical pattern will be confirmed when the Polkadot price jumps over the resistance level equal to the peak at $37.46, a 27.31% rise from the current price. If this happens, DOT could explore the May 18 range high above 45.
DOT/USD Four-Hour Chart
This bullish narrative is reinforced by the Moving Average Convergence Divergence (MACD) on the four-hour chart that is about to send a bullish crypto signal. This might occur in the near term when the MACD line (blue) crossed over the signal line. The uptrend will gain more momentum once the MACD crosses the neutral line into the positive region.
Note that a daily closure above the immediate barrier at $30 is crucial to sustaining the anticipated upward breakout.
Can Polkadot’s Upward Breakout Be Invalidated?
It is worth noting that the uptrend will be invalidated if the RSI retraces back towards the oversold zone. Closing the day under the 200-day SMA at $27.72 will also curtail the recovery efforts and trigger another sell-off, resulting in another correction to $21.70, September 07 low.
Looking to buy or trade Polkadot now? Invest at eToro!
Capital at risk
